Viewing the Critical Path
|
|
Critical Path Method (CPM) and PERT are closely related, and have become intertwined during nearly four decades of use in project management. Originally designed for deterministic projects, the CPM is used to highlight high-risk tasks in a project. It doesn’t matter that the durations for the critical tasks were developed with PERT methods.
CPM is a method used to analyze the relationships between activities in a project. The critical path is the series of interrelated tasks that takes the longest time, so it therefore affects the projected finish date. To see the paths in a project file, display a network diagram by choosing View Ø Network Diagram from the menu. The network diagram is a flowchart of the project activities. Figure 13.5 shows a segment of the network diagram for the XYZ-BOT project.
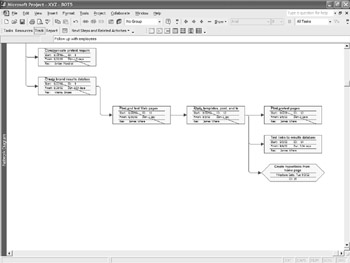
Figure 13.5: The network diagram shows the task paths.
Each task that appears is in an individual box. Summary tasks are parallelograms, individual tasks are displayed in rectangular boxes, and milestones are shown as hexagrams. Click the expand or collapse buttons above summary tasks to show or hide summary task’s subtasks. Double-click a task box to open the Task Information Form for the task. If you prefer the network diagram to the Gantt Chart view, you can create or remove task dependencies and assign resources in this view.
The lines between tasks are the dependencies created by using the Link Tasks button. To display more of the project, choose View Ø Zoom from the menu to open the Zoom dialog box, shown next.
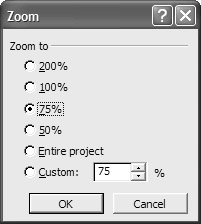
| Warning | The smallest zoom is 25%. If you choose Entire Project and your project can’t be displayed in its entirety at 25%, you’ll be prompted to accept the 25% setting. |
In the network diagram, the tasks within the critical path are outlined in boldface. As you can see in Figure 13.6, the critical path for our project starts in the upper left corner, and continues across the bottom of the application window.
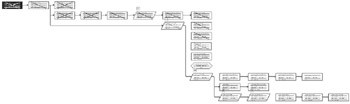
Figure 13.6: The critical path is the series of tasks with the longest duration.
The network diagram increases in utility as the project progresses. You can use filters in the network diagram as you would in the Gantt Chart view, so you can, for example, display only critical tasks, tasks that are over budget, or tasks that are currently in progress. Figure 13.7 shows the XYZ-BOT project’s in-progress tasks.
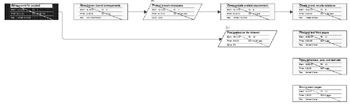
Figure 13.7: Filter the network diagram for in progress tasks.
| Tip | For information on customizing the network diagram, see Chapter 16. |
|
|
EAN: 2147483647
Pages: 241