Building a Project
|
|
The first time you launch Microsoft Project from the Windows Programs menu (Start Ø All Programs Ø Microsoft Project), Project opens a new project with the Project Guide in Gantt Chart view, as shown in Figure 4.1. The timeline in the right pane displays dates, beginning today; the Task pane on the left displays various New Project operations.
| Tip | You can close the Task pane by clicking the X in the pane’s top right corner, and open/ close it using the Show/Hide Project Guide button on the Project Guide toolbar. |
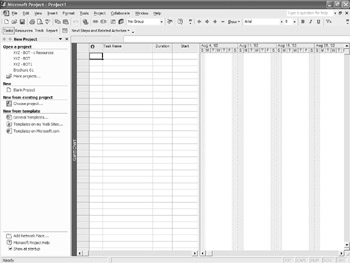
Figure 4.1: The Project 2002 opening screen, with New Project operations listed in the Task pane.
Defining the Project
There are three activities you should complete before you begin entering individual project tasks: setting file properties, entering project working times, and adding project properties. You can do these activities in any order, but they must be completed prior to other tasks. Although setting properties for your project file is optional, you may already be in the habit of doing this when you start a file in other applications. Choose File Ø Properties to open the Properties dialog box shown in Figure 4.2. Select the Summary tab, and make sure that you’re listed as the Author; then enter a few keywords and a summary, if you want. You’ll find detailed information on file properties in Chapter 6.
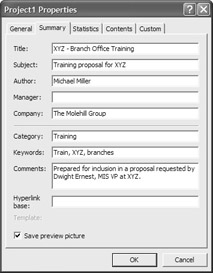
Figure 4.2: Use the Properties dialog box to enter details about your new project.
Establishing Working Times
You can set the options and working times in the standard calendar that all other calendars use as a default. Choose Tools Ø Change Working Time to open the Change Working Time dialog box, shown in Figure 4.3. Make sure that Standard (Project Calendar) is selected in the For drop-down list.
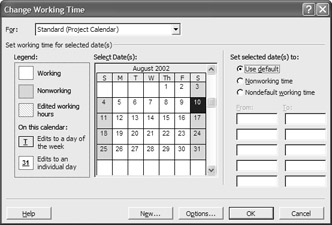
Figure 4.3: Set working days in the Change Working Time dialog box.
The default work times are 8:00 a.m. to 12:00 p.m. and 1:00 p.m. until 5:00 p.m., Monday through Friday, 52 weeks of the year—eight working hours every day with a nonworking hour for lunch. If this calendar doesn’t reflect the working hours for human and nonhuman resources you’ll assign to your project tasks, now is the time to change it.
| Warning | Establishing working times in the project’s calendar is not an optional activity. If you fail to set working times before entering tasks, you won’t have the advantage of seeing flashing warnings or audible signals—unfortunately. Don’t lose sight of the fact that calendar settings affect every aspect of the project, and changes to the base working times later in the project cycle aren’t fully reflected in tasks that have already been assigned resources. |
Click to select an individual day, or click the header buttons at the top of the calendar control to select every day in the column. Set selected days as working or nonworking by using the option buttons on the right side of the calendar control. If your organization gives the entire staff Christmas Day off, make December 25 a nonworking day. Project won’t schedule tasks on that day, so you won’t find yourself acting like Scrooge, explaining that your project could have been completed on time were it not for Christmas.
Type times into the From and To boxes to indicate working hours for the selected days. Changing work times doesn’t necessarily change the working hours in a day. Working from 9:00 a.m. until 12:00 p.m. and then from 12:30 p.m. until 5:30 p.m. still yields an 8-hour workday. Some offices, however, work 10- or 7-hour days. If you change the number of working hours from the default 8 hours, you also need to change the Hours Per Day and Hours Per Week calendar options. Click the Options button in the Change Working Time dialog box to jump to the Calendar tab in the Options dialog box (see Figure 4.4).
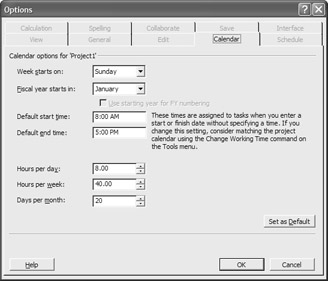
Figure 4.4: Change the number of hours in a day or week in the Options dialog box.
Make sure that the Calendar options are in sync with your calendars. The Hours Per Day option determines how Project converts durations. If Hours Per Day is 8, Project converts two days to 16 hours. When Hours Per Day is set to 10, Project converts two days to 20 hours. Hours Per Week and Days Per Month are also used to convert durations.
| Note | You’ll find more information on calendars and calendar options in the section “Defining the Project Calendar” in Chapter 6. |
After you set working and nonworking days and change the calendar options (if necessary), click OK to save your changes.
Setting Project Properties
Choose Project Ø Project Information to open the Project Information dialog box, shown in Figure 4.5. There are three information settings you’ll want to affirm or change: task scheduling method, priority, and calendar.
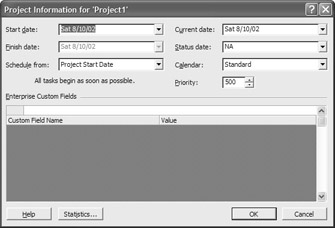
Figure 4.5: Set a project’s task scheduling method, priority, and default calendar in the Project Information dialog box.
A project can be scheduled from the start date until its completion, or it can be scheduled backward from the finish date. For example, you can start scheduling tasks on June 1 and schedule forward, or start on December 1 and schedule backward—but you can’t set both the start and completion dates at the same time. The Start Date method is the default for all new projects; Project schedules all tasks to begin as soon as possible. When you choose Project Finish Date from the Schedule From drop-down list, tasks are scheduled to begin as late as possible. Use the calendar control to set the Start Date or Finish Date options.

From the Calendar drop-down list (refer to Figure 4.5), select the calendar you used for working times so that it will be used as the project calendar.
The Priority setting is used to establish this project’s priority, relative to other projects that use the same resource pool. The default is 500; priority values range from 0 to 1,000. If your project is the most important project on the table right now, choose a higher number.
Planning Project Activities
For this phase of project creation, you need your list of project tasks, resource references such as an employee directory and/or materials list, and the estimated costs for resources.
Entering the Task List
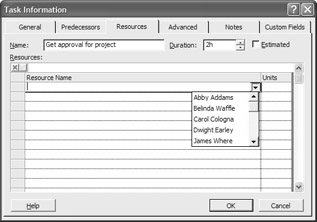
You enter your project tasks in Project’s Gantt Chart view. You then drag and drop tasks to rearrange them in a specific order. To enter a task, either click in the Task Name text box and enter the task’s name, or double-click in the Task Name text box to open a Task Information dialog box, shown in Figure 4.6. Enter the task name on the General tab.
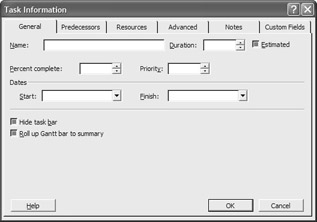
Figure 4.6: Enter task information in the Task Information dialog box.
If you are entering tasks directly in Gantt Chart view, you can adjust the Gantt chart task columns by pointing to the right edge of the column header button, as you would with columns in Excel or Access. The pointer changes to a column adjustment tool. Drag to the right to widen the column, or double-click to have Project size the column to fit the contents. Drag the vertical gray bar between the task columns and the Gantt chart to display additional columns of task information:
![]()
| Note | If you created your list of tasks in another application, you may be able to import them. See Chapter 18 for information on importing and exporting in Project. |
Outlining Tasks
Some project managers begin by entering all the lower-level tasks first; others enter summary tasks and then insert the subtasks and work packages. Use the Indent and Outdent buttons on the Formatting toolbar to indent selected lower-level tasks in relationship to the higher-level summary tasks. Tasks are displayed in the Gantt chart with blue bars; summary tasks are represented by a black bar with black triangular terminators. Figure 4.7 shows a project Gantt chart with summary tasks and lower-level tasks.
| Note | For more about work packages, see the section “Analyzing Project Activities” in Chapter 2. |
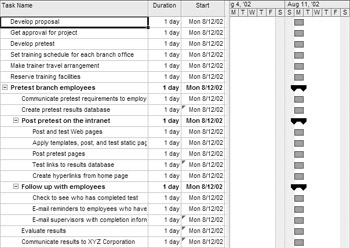
Figure 4.7: Use the Indent and Outdent buttons to outline tasks and subtasks.
| Tip | The Task Information dialog box has a Notes tab that you will use frequently, beginning in the project design phase. The Notes tab is the ideal place to record customer specifications, quality measurements, and general information related to a task. You can also attach related documents such as Word documents or Excel spreadsheets that support the task in some way. |
Entering Task Durations
Duration is the result of the formula work divided by assigned units, where work is the time required to complete the task and assigned units are the resources you apply to the task. With the exception of milestones, discussed as follows, every task has a duration: the number of days or hours that resources will be employed on the task.
| Note | Duration and its relationship to resource assignments and task type is Project’s black box—the unknown area where project managers report having the greatest difficulty. You’ll find a wealth of information on task duration in Chapter 9, and more about resource assignments in Chapter 10. |
Project’s default duration is an estimate of one day. You know it’s an estimate because Project appends a question mark to the duration. You can enter durations in minutes (m), hours (h), days (d), weeks (w), or months (mo). Type a number and then enter the abbreviation for the time unit in the duration column of the Gantt chart: 3m for 3 minutes, 4h for 4 hours, 5d for 5 days, and so on. If the duration still needs fine-tuning, type a question mark after the time unit abbreviation, or select the Estimated check box in the Task Information dialog box. You can’t enter durations for summary tasks; Project calculates summary duration from the durations of the summary task’s subtasks. As you set task durations, Project redraws the bars in the Gantt chart to reflect task duration, as shown in Figure 4.8.
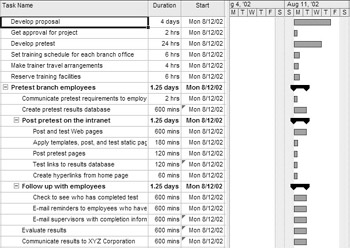
Figure 4.8: Enter task dura-tions in the Gantt Chart view:
A milestone is a significant event in your project. Enter milestones as you would other tasks. Mark the task as a milestone by setting the task duration to 0, either in the third column of the Gantt Chart view or in the Duration text box in the Task Information dialog box. Alternately, mark the task as a milestone by selecting the Mark Task As Milestone check box on the Advanced tab of the Task Information dialog box.
| Note | For information on outlining, project phases, and task duration, see Chapter 7. |
Setting Task Relationships
If there’s a dependency between two or more tasks, it needs to be reflected in your project file. The links between tasks are the heart of project scheduling. There are four types of links in Project 2002:
-
Finish-to-Start (the default): Task A must be finished before Task B can start.
-
Start-to-Start: Task A must start before Task B can start.
-
Finish-to-Finish: Task A must finish before Task B finishes.
-
Start-to-Finish: Task A must be started before Task B can be completed.
You can set task relationships by linking tasks as you go along; or wait until you’ve entered all the tasks and outlined subtasks, and work packages before linking tasks. We recommend waiting, particularly if you’re creating the project file during the project design phase for use in the Project Summary. It’s chaotic enough already—you don’t need extra practice removing and adding links as new tasks get added to your list.
To link tasks, hold Ctrl and select the tasks you want to link, in order. Alternately, hold Shift, and click to select consecutive tasks. For example, choose the Develop Proposal task and then the Get Approval for Project task. Click the Link Tasks button on the Standard toolbar. (If you choose Get Approval for Project first, the link indicates that you will somehow get approval before you’ve actually developed your proposal.) As you add links, the Gantt chart’s task bars adjust along the timeline to create the project schedule. Indented subtasks are already related to their summary tasks, so they can’t be linked. You can, however, link subtasks within and between summary tasks. Figure 4.9 shows linked tasks in the XYZ-BOT project file.
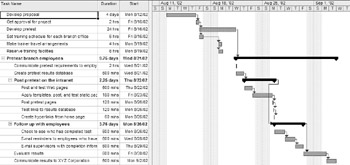
Figure 4.9: Links create the project schedule.
To unlink previously linked tasks, select the linked tasks and then click the Unlink Tasks button on the Standard toolbar.
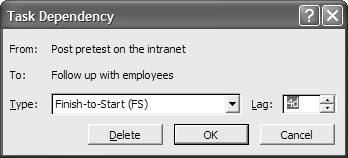
A link can be modified to build in some lag. For example, after we post our branch training pretest on the intranet, employees need a few days to take the test before we begin nagging them about it. We’ll link the Post Pretest and Follow-up tasks Finish-to-Start. We’ll then add four days of lag to the schedule by double-clicking the link line in the Gantt chart and setting the lag value in the Task Dependency dialog box.
This is a great time to save your project file. Choose File Ø Save from the menu. You are asked whether you want to save the file with or without a baseline. Save the file without a baseline for now—you’ll save the baseline after the project schedule has been approved.
| Note | For more information on dependency and linking see Chapter 8. |
Entering Resource Information
Resources are the people, materials, and equipment assigned to project tasks. Project enables you to assign resources “on-the-fly” by entering resource names on the Resources tab of the Task Information dialog box, or in the sixth column of the Gantt chart’s task grid.
| Warning | Entering resources “on-the-fly” can be both a blessing and a curse because every typo or name version becomes an accidental “new” resource. Andy and Andie, Rich and Richard, James and Jim all become different resources, even if they’re the same people. |
Entering Resources
When you enter resources in Project’s Resource sheet and choose them from the drop-down lists in various columns and dialog boxes, you’re less likely to introduce error. Choose View Ø Resource Sheet to open your project’s resource sheet; then double-click in any cell of the resource sheet to open a Resource Information dialog box, shown in Figure 4.10.
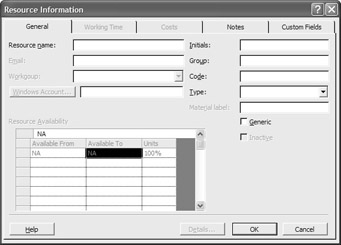
Figure 4.10: The project’s resource information is entered in the Resource Infor-mation dialog box.
Enter the following for each resource: resource name, type (work or material), material label (for example tons, feet, or cubic yards), initials (displayed in Gantt charts and reports), maximum units (percentage or value), standard and overtime rates, cost per use, accrual method, base calendar, and an optional resource code you can use later for sorting and grouping. If you don’t know the names of all your resources, enter placeholders (Programmer 1, Trainer A, Trainer B), and change the names later.
| Tip | People, equipment, and other resources that have a time-based (hourly, daily, or monthly) cost are considered work resources; materials are the raw goods and consumables used by the unit. |
If a resource is available less than 100% of the time, be sure to adjust the maximum units percentage because it affects the project schedule. (With the possible exception of contract and production employees, human resources aren’t available 100% of the time. There are e-mails to answer, telephone calls to return, and committee meetings to attend that are unrelated to the project.) The Resource Information dialog box has additional fields, including the range of available dates for a resource. Our resource sheet is shown in Figure 4.11.
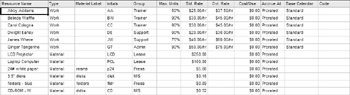
Figure 4.11: Add resources in the project’s Resource Sheet.
| Note | You can add resources from an Outlook address book, import them from another application, or use resources from another Project file. See Chapter 9 for detailed information about resources. |
Assigning Resources to Tasks
Project offers a variety of ways to assign resources—enough different ways, in fact, to become confusing. We’ll concentrate on two specific methods. Switch back to the Gantt Chart view (View Ø Gantt Chart), and select a task. You can do this in one of two ways. You can double-click the task to open the Task Information dialog box, click the Resources tab, and choose resources from the drop-down list.
You can also click the Resources button on the Standard toolbar to open the Assign Resources dialog box, shown here.
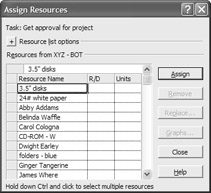
Shift-click, or hold Ctrl and click to select resources for the task and then click the Assign button to assign the resources to the task. Each resource is assigned fully to the task. If a resource is assigned at less than 100%, its maximum units in the resource sheet is less than 100%. If you want to have the resource work half-time on the task, change the percentage in the Units Assigned column.
When you assign materials, enter the number of units required in the Units Assigned column. Project adds the materials label from the Resource Sheet (see Figure 4.11).
The Assign Resources dialog box remains open so you can move back to the grid, select one or more tasks in the task grid, and assign resources. Work through the task list, assigning resources to all tasks. Don’t assign resources to summary tasks. As you assign resources, the resource names are displayed at the right end of the task bar, as shown in Figure 4.12.
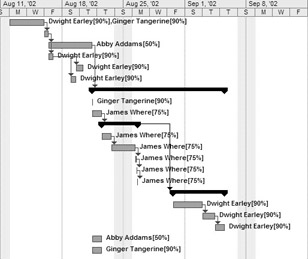
Figure 4.12: Assigned resource names appear in the Gantt chart.
| Tip | You can easily change the Gantt Chart view settings to display initials, group names, or more information other than the default. See Chapter 16 for information about modifying views. |
Estimating Project Costs
There are two types of costs associated with a project or a project task: variable costs and fixed costs. The variable costs should already be accounted for in the hourly costs, overtime costs, and per-use costs of work resources and materials assigned to tasks. You can add fixed costs to specific tasks.
| Tip | Use the Notes tab of the Task Information dialog box to record information about cost components. |
Until now, we’ve worked in the Gantt Chart view’s Entry Table. The Cost Table provides useful information about the cost of each project task. In Gantt Chart view, choose View Ø Table Ø Cost to display the Cost Table. Drag the vertical split bar that runs between the table and the Gantt chart to display all the columns of the Cost Table, as shown in Figure 4.13.
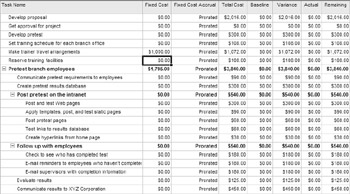
Figure 4.13: The Cost Table shows fixed and variable costs for each task.
Enter the fixed cost associated with a specific task or summary task in the Fixed Cost column. Our project includes a few fixed costs. We’ll add the airline ticket costs to each site to the Make Trainer Travel Arrangements task. (It doesn’t matter how many hours of training occur at the site; it costs a set amount for a round-trip ticket—for our example, let’s say the total cost is $1,000.) We’re also purchasing authorware software to create the pretest. The program costs $1,795, so we’ll attach this fixed cost to the pretest. Our fixed and variable costs are shown in Figure 4.13.
| Tip | If you want to enter fixed costs for the entire project, display the project summary task. Choose Tools Ø Options from the menu to display the Options dialog box. Click the View tab. Select the Project Summary Task check box, and then click OK. The project summary task is displayed as the first task in the table. |
Optimizing the Plan
Optimizing the project plan means adjusting resources, costs, and the schedule while maintaining the quality standards specified in the project plan. The relationship between resources, budget, and timeline means that you’re looking for an ideal balance between the three that accurately reflects your organization’s priorities for the project.
| Tip | Optimization relies on the accuracy of the task, cost, and resource information you’ve already entered. See Chapter 13 for methods to accurately estimate task duration and cost. |
Optimizing Resources
You’ve assigned and scheduled resources. To optimize resources, find out whether any of the resources are overallocated by choosing View Ø Resource Sheet. Overallocated resources stick out—they’re red and bold, and a leveling icon appears in the Information column. If you point to the icon, a ScreenTip appears with a leveling setting (for example, Day By Day) to select when leveling this resource. (See “Using the Leveling Feature” later in this section.)
Understanding Resource Leveling
If you have overallocated resources, you can level the resources by:
-
Delaying a task until the assigned resource can complete it
-
Delaying part of the task by splitting the task
-
Assigning additional resources to the task
Project can automatically level resources to avoid overallocation and optimize resources. Project takes a number of factors into account when leveling; however, Project levels resources by delaying or splitting tasks—it doesn’t add resources.
Delaying tasks extends the project schedule; adding resources increases costs unless the added resources were underallocated. There is another possibility, of course. You can incur overtime to complete the project. We don’t recommend starting a project with scheduled overtime. There’s ample evidence that the typical rush project with extended periods of overtime has high hidden costs, including lowered employee morale and product quality.
| Tip | Project’s bias is to optimize resources and costs while adjusting the timeline. This may not be the appropriate solution for your project, so you may prefer to optimize resources yourself. Fortunately, Project provides all the information you need to level resources. See Chapter 11 for detailed information on leveling tasks individually and using automatic leveling. |
Using the Leveling Feature
Before using Project’s leveling feature, there are two settings you should adjust for the absolutely critical tasks: constraints and priority. Set constraints on the Advanced tab of the Task Information dialog box, shown in Figure 4.14. Choose the Constraint type and then set a Constraint date. Tasks, like projects, have a priority setting between 0 and 1,000. Tasks with lower values are leveled before tasks with a higher priority. Don’t spend a lot of time worrying about the difference between 500 and 550. If a task must be started or finished by a particular date, constrain it and then set its priority to 1,000. Save a copy of the unleveled project file before proceeding. You might also want to choose Project Ø Project Information to check the scheduled finish date for the project before resource optimization.
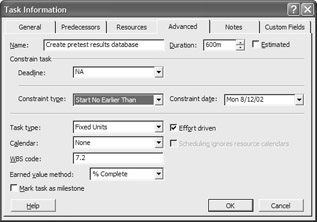
Figure 4.14: Constrain critical tasks before using automatic leveling.
Choose Tools Ø Level Resources to open the Resource Leveling dialog box, shown in Figure 4.15. Use this dialog box to set how Project should level resources. With the Leveling Calculation set to Automatic, Project will adjust tasks as soon as you assign a resource that creates an overallocation. For now, leave this option on the Manual default setting so that leveling occurs only when you open this dialog box.
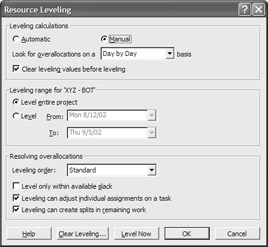
Figure 4.15: Set options and adjust tasks for overallocated resources.
In the Look For Overallocations drop-down list, choose the time period that Project should examine to spot an overallocation. If, for example, you check overallocations on a week-by-week basis, a person can be scheduled to work 16 hours two days in a row. If you check on a day-by-day basis, the person is overallocated on both 16-hour days, so the tasks on those days would be adjusted. After you set the time period, click the Level Now button, and Project examines overallocated resources and the tasks causing overallocation. It then adjusts the tasks to optimize the resources.
| Tip | If you allocated a resource to a summary task and one of its subtasks, leveling pauses and you are prompted to stop leveling or skip this task. Note the summary task with the resource assigned, stop leveling, remove the assignment, and start leveling again. |
Leveling takes only a few seconds. Choose View Ø More Views Ø Leveling Gantt, shown in Figure 4.16, to see the changes made by leveling.
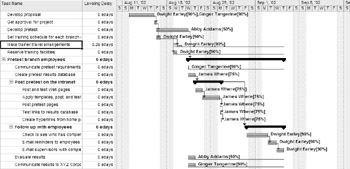
Figure 4.16: The Leveling Gantt view shows delays added to optimize resource allocation.
Optimizing the Project Schedule
You optimize the schedule to ensure that the project will be completed in an acceptable timeframe. Don’t worry about optimizing unless the schedule runs longer than desired. Choose Project Ø Project Information to see the current project Finish Date. If you need to adjust the project to finish on time, here are a few strategies:
-
Start earlier: Change the project Start Date in the Project Information dialog box (Project Ø Project Information).
-
Change one or more calendars: If you’re going to be working Saturdays or longer hours on the weekdays, adjust the calendar accordingly (Tools Ø Change Working Time).
-
Do less: Get a stakeholder agreement to limit on project scope by eliminating deliverables or cutting the project into phases, one or more of which will be completed by the desired finish date.
-
Decrease quality: Adopt lower quality standards or less precise measurements.
In every project, there are tasks that require more attention because failure to complete them on time affects the project completion date. These tasks are in the critical path. To view the critical tasks in your project, make sure that you’re in Gantt Chart view and then choose Critical from the Filter drop-down list on the Formatting toolbar.
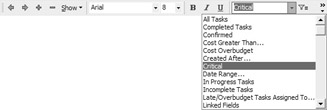
Project hides all noncritical tasks. The remaining critical tasks are the tasks that should draw your attention during the project, or those that you should focus on optimizing to affect the timeline now. For example, you can do the following:
-
Review tasks to identify and eliminate optional tasks.
-
Make sure that task constraints, especially Start After constraints, are necessary.
-
Break down critical tasks into work packages that you can assign to separate resources.
-
Review and remove unnecessary links on the critical path.
-
Add resources to critical tasks.
After you make one or more of the adjustments listed earlier, return to the Resource Sheet to make sure that you haven’t accidentally introduced an overallocation. If you have, you can do the following:
-
Assign additional resources.
-
Replace one resource with another.
-
Adjust the amount of time that a resource is available for a task.
After you’ve made changes, level the resources again and then check to make sure the project finish date is still acceptable.
Optimizing the Project Budget
Optimizing the budget is a popular pastime. Project costs affect the bottom line for your department and the entire organization. To find out what your project, as designed, is estimated to cost, choose Project Ø Project Information to open the Project Information dialog box. Click the Statistics button in the dialog box to open the Project Statistics dialog box, shown in Figure 4.17. This dialog box shows the vital statistics for the project, including the total cost, actual cost-to-date, and amounts remaining in the project budget.
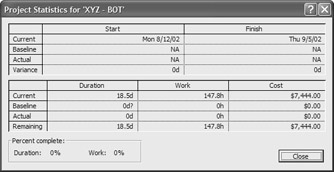
Figure 4.17: The Project Statistics dialog box contains a wealth of summary information for planning and management.
Here are some strategies to pursue when the total project costs need to be lowered:
-
Replace expensive resources with less expensive resources.
-
Eliminate overtime.
-
Reduce project scope by eliminating deliverables or project phases.
-
Adopt more relaxed standards.
Communicating the Project Plan
We leveled resources, and also determined that the timeline and cost are acceptable. It’s now time to distribute the project plan to stakeholders and workgroup members. Before we waste too many trees, though, we should ask for feedback from potential workgroup members or other project managers in our organization. To send the entire project file to another Project user, choose File Ø Send To Ø Mail Recipient (As Attachment). Project will start your e-mail client and open a message with the project file attached. Address the message, add some explanatory text, and click Send. The attached file is a copy, so you’ll have to incorporate user suggestions into your original project file.
After all feedback is incorporated, you can print views and reports from Project to communicate the project essentials to shareholders, managers, and workgroup members. In our project, we’ll print the Calendar and Resource Sheet views, three versions of the Gantt chart, the Resource Usage Workload, the project budget, and the Top Level Task reports to distribute to appropriate stakeholders.
| Note | You’ll want to print views and reports that are easy for the recipients to understand. Examine the views and reports in Chapters 16 and 17 to find those that best meet your stakeholders’ information requirements. If you need to fine tune your documents, these chapters include instructions on customizing views and reports. |
Printing Views
To print the Gantt chart or any other view, first use the View menu to display the view. Choose the data you want to display by selecting a table (View Ø Table Ø specific type of table); then adjust the columns and position the timeline. The Gantt chart prints with the timescale displayed. You may want to print a more condensed timescale, either because your project spans a number of months or the audience for the printout needs only summary data. To change the timescale, right-click the timescale at the top of the chart and choose Timescale from the shortcut menu. Alternately, choose Format Ø Timescale from the menu. In the Timescale dialog box, shown in Figure 4.18, set the Major and Minor scales, such as weeks and days, days and hours, months and days. Check the preview in the dialog box as you change scales, and set other display options. Click the Nonworking Time tab to change the way weekends and holidays are displayed in the view.
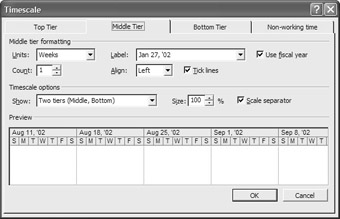
Figure 4.18: Adjust the timescale in the Timescale dialog box.
| Tip | To change the text displayed in the Gantt chart, right-click an empty area of the Gantt chart and then choose Bar Styles from the shortcut menu. |
Click the Print button on the Standard toolbar to print the view as it appears. To set a range of dates or print multiple copies, choose File Ø Print from the menu bar to open the Print dialog box.
We want to print filtered versions of the Gantt chart so that each group can see their tasks in isolation. To filter the Gantt chart, choose Resource Group from the Filter drop-down list on the Formatting toolbar. When the Resource Group dialog box appears, enter the name of the group from the Resource Sheet that you want to display. The Gantt chart will include only tasks for this group, as shown in Figure 4.19. Choose All Tasks from the Filter list to remove the filter.
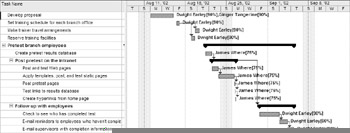
Figure 4.19: A filtered Gantt chart lets any group view only its own tasks.
| Tip | To change the header and footer text in a view or report, choose View Ø Header and Footer to use the Page Setup dialog box. |
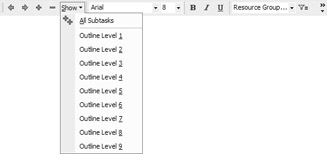
You can easily print a Gantt chart that shows only major tasks. Choose the level of task you want to display from the Show menu on the Formatting toolbar before printing the view:
Printing Reports
With Project, you can print reports about every aspect of your project. As with printed views, you can change reports by using tables and filters. To print a report, choose View Ø Reports to open the Reports dialog box.
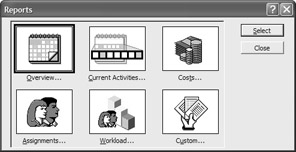
Double-click the category of report you want to print (in this case, Workload) to see the reports included in the category.
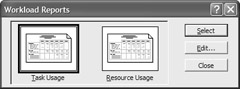
Double-click a report, such as the Resource Usage report,or select the report and then click the Select button. Project opens it in the Print Preview window, as shown in Figure 4.20. Click the Print button to print the report, or click the Close button to discard the report and return to the dialog box.
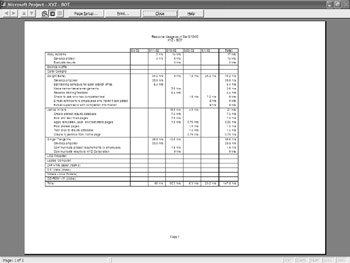
Figure 4.20: The Resource Usage report.
The views and reports are the core of the final project proposal. We’ll also revise the project summary that we created earlier in Microsoft Word, with references to each of the printed Project icons and reports to round out the printed documentation.
The project documentation isn’t limited to paper-based communications. If we still need to “sell” this project, or want to garner some enthusiasm and support, we’ll create a PowerPoint presentation that shows the project goals, deliverables, timeline, and costs.
|
|
EAN: 2147483647
Pages: 241