Closing a Project
|
|
One of the most important factors in setting up a project is defining when a project can be deemed complete. If the deliverables and milestones are explicit, it will be clear when the project has met them, or when it is no longer possible or desirable to meet the project’s objectives. So, the first step in closing a project actually happens before the project even starts.
In the early stages of the project development, you must decide what the project will look like when it is done—what determines success? Obviously, if the project involves building a piece of machinery, the meeting of that objective will be more obvious than for a project designed to raise awareness about the importance of exercise in maintaining good physical health. In either case, however, a clear definition of success at the outset goes a long way toward determining whether you have completed it.
Success is often defined in a very limited way: Did you build this machine or produce this publication? Success, however, may come in many different and surprising forms. Perhaps in failing to produce the item you set out to produce, you discovered something totally unexpected. Perhaps the process did not work in this project, but it became clear how the same process could be successful in another project; or maybe the team came together for the first time and now, knowing what to expect from one another, it will be successful the next time around. Although you can reach some conclusions about a project based on goal attainment, keep yourself open to other ways a project may have succeeded or failed, apart from the project’s objectives.
After you decide that a project has met its objectives—or that it will not reach its objectives—you can proceed with the other steps involved in closing a project. These steps include the following:
-
Conducting a project review, including a review of the processes used in the project
-
Evaluating project results
-
Communicating information about the project results to all the stakeholders
-
Preparing for future projects
If the project is the result of a contract for your services, you may also have to finalize contract-related issues as part of closing a project. The contract may include an inspection or sign-off before the final invoice is paid. If that’s the case, you certainly want to take care of those issues so you can submit the final invoice for payment. All of these items should be listed in the original project-planning materials—it’s always a good idea to go back and review everything to which you agreed at the beginning to make sure you are not missing anything. When you are sure you know what you need to wrap up the project, you are ready to move on to the project review meeting.
Conducting a Project Review
One person rarely accomplishes a project in its entirety. That’s not to say that a person working alone couldn’t use Microsoft Project to help guide them through a complicated project; Project certainly has all the tools you need to manage tasks and schedules in a project, even if you are the only resource available to the project. Most projects, however, are the result of a team effort. Of course, we’re using the word team in its loosest sense because teams do not necessarily require cohesiveness—only the effective ones do!
Assuming that you are working on a project with a group of people, one of the most beneficial ways to begin the process of closing a project is to hold a final project review meeting. This meeting, sometimes referred to as a post-implementation review or postmortem, should include as many of the key players involved in the project as possible, regardless of how insignificant their role. The meeting should be designed to minimize intimidation and encourage open and honest participation. If a team member anticipates that he is going to be hung out to dry, you can be certain that the review will be of limited value to the continuing quality-improvement process.
In preparing for the project review meeting, you may want to make several end-of-project reports available to the review team. Microsoft Project can create many of these reports for you, giving you the data you need to support any conclusions that come from the review and providing information that could open doors to discussion of other factors that might have been overlooked. You can find out more about creating these end-of-project reports in Project in “Creating Final Reports” later in this chapter.
During the review meeting, someone should be designated as the recorder to keep a record of the key points that come from the review. At the end of the review meeting, these key points can be written up and included in the final project report.
Reviewing the Project Constraints
One definition of project management is to efficiently use resources to complete a project as designed, on time, at the desired level of performance, and within budget. When conducting a project review, this definition is often a good place to start a general discussion about the project. Using the criteria listed in this definition, how did you do? Did you use resources efficiently? Was the project completed as designed? Was it completed on time? Do the results meet the standards of quality and performance? How do actual costs compare to budgeted costs? This discussion often evokes the need to dig deeper, and perhaps more scientifically, as you break down the project life cycle.
Problem Identification: Was the Problem Accurately Identified?
Accurate identification of a problem is the only way to solve it. As you look back on the entire project, could you have done a better job identifying the problem? Did you identify the real problem, or did you mistake a symptom for the actual problem?
Definition: Was the Problem Clearly Defined?
After the problem was identified, did you research its causes thoroughly? Did you consider all the possible causes of a problem? Is there anything you missed?
A young man was visiting with his grandmother in the garden behind her old farmhouse. His grandmother commented how good it was to be out in the yard where she could see the pristine lake that bordered her property. She told her grandson that she didn’t get outside much anymore and missed the lake, which she couldn’t see from the house. The grandson looked at the overgrown hedgerow that ran between the house and the garden, and vowed to himself that next weekend he’d come over and cut the hedgerow back so his grandmother could see the lake. So, the following Saturday morning, he traveled out to his grandmother’s house and, using an electric trimmer, had that hedgerow cut back to size in no time at all. When his grandmother answered his knock at her door, the young man smiled proudly and said, “Grandma, I trimmed that overgrown hedgerow for you, so now you’ll be able to see the lake from the house.” His grandmother let out a hearty laugh and said, “Silly boy, I still can’t see the lake—there are no windows on that side of the house.”
Project Design: Did the Project’s Design Fit the Problem Definition?
You may have developed a fantastic product as a result of your project—but if it’s the solution to the wrong problem, you’ve missed the boat. In this stage of the review, you want to look at each step in the entire design process:
Define the Project’s Objectives Were the objectives measurable and achievable?
Finalize the Project Scope Was the project scope inclusive and exclusive enough? Was it wide enough to accomplish the objectives and narrow enough to stay on target?
Identify Project Tasks Did the tasks fit the job? Were they consistent with the project scope? Were some tasks unnecessary, and did any tasks get missed?
Break Each Task into Logical Components Were the tasks defined logically? Were they broken down sufficiently enough to be understandable to the team members?
Assign Resources Were the right resources involved in the project? Were the right material resources identified? Were any needed resources missed?
Create Estimates Were the cost estimates accurate? Were the correct rates used for work resources? Were any fixed costs missed in the cost estimates? Were any estimated fixed costs found to be unnecessary.
As part of the design review, you may also want to find out if team members and other stakeholders had enough input into the design. Were their ideas and concerns heard as the project was designed? What other methods could be used to solicit appropriate input into the design phase?
Development: How Did the Project Unfold?
The development phase is where the real fun begins. Initial planning is complete and the actual work starts. During this part of the review, you want to find out what it was like to be doing the work of the project. Certainly, it’s important to document whether the project stayed on schedule, but even more importantly, you want to find out what happened that took it off schedule. Was it poor planning, or did something interfere with the process? If some tasks finished ahead of schedule, how did that affect the rest of the schedule? Were schedules realistic to begin with? Were resource assignments realistic? Did the plan include enough material resources as well as work resources? How were over- or underallocations handled?
At this stage of the review, you also want to look at how the project team functioned. Examine the communication methods you used—did everyone feel that they were in the loop? E-mail, telephone, face-to-face meetings, written correspondence, and the Web are all valid forms of project communication. Which methods worked best? What could be done to improve communication next time? Should additional methods of communication be tried?
Implementation: Could the Results of the Project Be Implemented?
Projects are generally designed to create something new, whether it is something as concrete as an airplane, or as intangible as a method to develop high morale within a company. When a project is completed, you should be able to implement the results in some way: use the object you created, sell the product, implement the policy. If the results can’t be implemented, what went wrong along the way? Was it something intrinsic to the project, or are external factors influencing its implementation? For example, if the project’s objective was to develop a prototype for a new software product, is there money available to finance the production of the software? What factors are outside of your control? What, if anything, could you and the project team have done differently to carry the project through implementation? Does the product work, or is a lot of rework required?
Evaluation: Are You Happy with the Results?
The final stage of the review is the formal evaluation stage. After all is said and done, did you accomplish your objectives? Are the stakeholders satisfied with the results? Do team members have other process concerns about things that impacted the project? If you do this project again, what will you do differently? How would you rate the overall success of this project?
Creating End-of-Project Reports and Views
Although the review meeting is as much focused on process as it is on performance, Microsoft Project can help you prepare reports that are useful in conducting the review. These reports give you the facts and figures to fuel the discussion, and ensure that everyone is working from the same data. The reports can also show problems and successes that you might have otherwise overlooked.
Project has two vehicles for directly reporting project data: reports and views. Chapter 16 provides details about how to create custom views in Project, how to add and remove columns, and how to sort and filter views to see just the data you want to see. Chapter 17 covers how to use the built-in reports, and how to build custom reports that focus on particular data. You might also want to review Chapter 18 to learn how to export data from Project into Microsoft Excel and other applications to conduct even further analysis.
In this section, we’ll discuss the predefined reports and views that can give you the data you need to conduct the postmortem and prepare a final project report.
Using Project’s Predefined End-of-Project Reports
To create a Project report, choose View Ø Reports and then select the appropriate report category from the Reports dialog box, shown in Figure 19.1. Project has seven predefined reports that offer valuable data in preparing a final project report. There are three overview reports: Project Summary, Milestones, and Top-Level Tasks; and four costs reports: Budget, Earned Value, Overbudget Tasks, and Overbudget Resources.
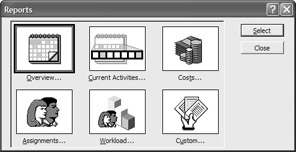
Figure 19.1: Select a report category to view predefined reports.
Project Summary Report
The Project Summary report, shown in Figure 19.2, is found by clicking the Overview category of the Reports dialog box and then clicking the Project Summary Report button. The Project Summary report provides an overview of the following:
-
Dates, including start and finish dates, baseline start and baseline finish, actual start and actual finish, and start variance and finish variance
-
Duration, including scheduled and remaining duration, baseline and actual duration, and variance and percent complete
-
Work, including scheduled and remaining work, baseline and actual work, and variance and percent complete
-
Costs, including scheduled and remaining costs, baseline and actual costs, and variance
-
Task Status, including the number of tasks not yet started, tasks in progress, tasks completed, and total tasks
-
Resource Status, including the number of work resources, overallocated work resources, material resources, and total resources
Tip The default Project Summary reports data in hours and days. You can change the report to reflect minutes, days, weeks, or months by resetting Project’s Schedule options for Duration and Work. From within any non-report view, choose Tools Ø Options to display the Options dialog box; then select the Schedule tab. Change the Duration Is Entered In and Work Is Entered In fields to reflect the desired measure.
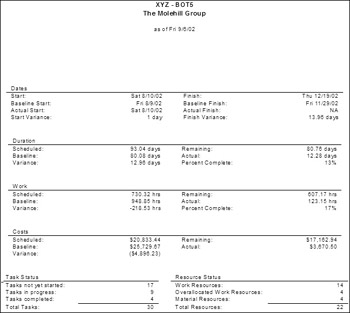
Figure 19.2: The Summary report shows: the key project: statistics.
Milestones Report
The Milestones report, found by clicking the Overview category of the Reports dialog box and shown in Figure 19.3, gives a summary of the project’s milestones. It includes Task ID, Task Name, Duration (0), Start and Finish Dates, and Predecessors.
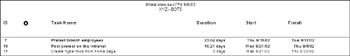
Figure 19.3: The Milestones report focuses on when the Project’s milestones were actually achieved.
Top-Level Tasks Report
The Top-Level Tasks report, shown in Figure 19.4, is an overview report that shows the Task ID; Task Name; and actual figures for Duration, Start, Finish, % Comp (Percent Complete), Cost, and Work. This report shows only Level One tasks on the outline, so you can focus in on the major activities of the project without getting lost in the details.
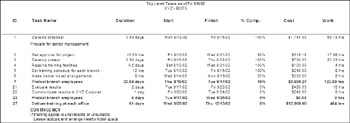
Figure 19.4: The Top-Level Tasks report shows actual schedule and cost figures.
Budget Report
The Budget report, shown in Figure 19.5, is found in the Costs category of the Reports dialog box. The Budget report includes columns for Task ID, TaskName, Fixed Cost, Fixed Cost Accrual (method), Total Cost, Baseline (costs), Variance, Actual and Remaining. You can use this report to see how actual costs compare to budgeted (baseline) tasks and how much money, if any, is remaining in any of the task budgets.
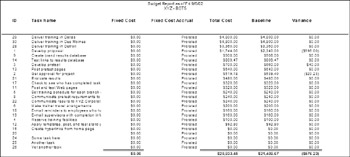
Figure 19.5: Use the Budget Report to view budgeted versus actual costs.
| Tip | If you find the Budget report somewhat limited, you can switch to the Cost table in Gantt Chart view to see all the data from the report. Print the table, or save the table as an Excel workbook or pivot table in which you can manipulate the data to your heart’s content. Select File Ø Save As and choose Microsoft Excel Workbook or Microsoft Excel PivotTable as the Save As Type at the bottom of the dialog box. |
Earned Value Report
The Earned Value report, shown in Figure 19.6, is a standard project-management report, designed to compare a project’s budgeted costs to actual costs. The Earned Value report shows the budget cost of work scheduled (BCWS), budgeted cost of work preformed (BCWP), actual cost of work performed (ACWP), scheduled variance (SV), cost variance (CV), estimate at completion (EAC), budget at completion (BAC), and variance at completion (VAC). Earned value can be monitored throughout a project’s lifecycle to measure the cost of work performed up to the status date or the date of the report. At the end of a project, the EAC, BAC, and VAC provide final summary data about the project. EAC is equivalent to the Cost field in Project; on this report, it shows the total scheduled or projected cost for a task. BAC is equivalent to the Baseline Cost field in Project. VAC is the difference between EAC and BAC.
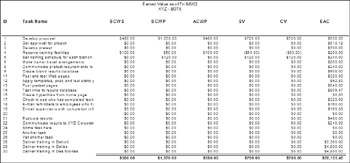
Figure 19.6: The Earned Value Analysis report shows the variance between actual and baseline costs.
| Note | For more about earned value analysis, see “Using Earned Value Analysis to Analyze Project Performance,” in Chapter 12. |
Overbudget Tasks Report
The Overbudget Tasks report, shown in Figure 19.7, contains the same fields as the Budget report, but displays only tasks that are over budget when compared to the baseline.
![]()
Figure 19.7: The Overbudget Tasks report focuses on tasks that have exceeded budget.
Overbudget Resources Report
The Overbudget Resources report, shown in Figure 19.8, identifies variances in the cost of resources. The report includes columns for ID, Resource Name, Cost, Baseline Cost, Variance, Actual Cost, and Remaining. You can use this report to see how you managed your work and material resources.
![]()
Figure 19.8: The Overbudget Resources report lists resources that cost more than planned.
Creating End-of-Project Views to Analyze Results
In addition to Project’s standard reports, you can print views that contain data you want to incorporate into the end-of-project review. Views are much more flexible than reports— you can add the columns you want and remove columns that don’t provide valuable information.
| Note | For more about working with and customizing views, see Chapter 16. |
Several views are particularly informative at the end of a project. The Gantt Chart view is certainly a good place to start. By applying different tables to the Gantt Chart view, you can focus on variances, cost, work, and so on. For example, Figure 19.9 shows the Gantt chart with the Tracking table, and Figure 19.10 shows the Gantt chart with the Cost table. (You may want to display all available columns; to do so, drag the vertical split bar off to the right so only the table is displayed.)
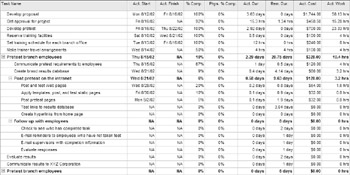
Figure 19.9: The Gantt Chart view with the Tracking table provides a summary of schedule data.
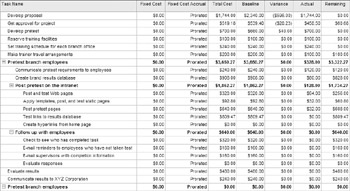
Figure 19.10: The Gantt Chart view with the Cost table provides a summary of cost data.
When you want a more graphical representation of schedule variances, switch to the Tracking Gantt view. This version of the Gantt chart shows both the baseline schedule and the actual schedule. The baseline schedule appears as light gray bars, and the actual schedule appears as solid blue bars. In Figure 19.11, you can easily see where the slippages in the project occurred.
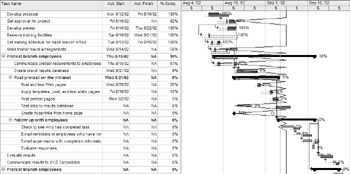
Figure 19.11: Switch to Tracking Gantt view for a graphical illustration of the schedule variances.
Communicating Project Results
After preparing all the project reports, and conducting the project review meeting, it’s time to make the project results public. Depending on your organization, on the project itself, and on the politics within the organization, communicating project results can be different for each project. For some projects in some organizations, it may mean that you prepare a written report, submit it to your supervisor, and that’s that. Other situations may call for a more dramatic report of project results. You may be asked to post a report to the company intranet, or perhaps give a presentation at the next company-wide teleconference.
In addition to the wealth of data you can print directly from Project, you can use Project’s export features to respond to just about any request for information that you receive. Table 19.1 lists common requests for information and a recommended method for responding to each request. Chapter 18 gives you more details about how to accomplish any of the methods that involve saving, copying, or using other export methods.
| Information Request | Report Method |
|---|---|
| Produce a printed report | Create and print Project’s reports and views. |
| Post results to a web page | Determine what fields you want to export to a web page from the task, resource, and assignment fields. See “Exporting Data as HTML” and “Exporting Data as XML” in Chapter 18 to learn how to save as a web page. |
| Create charts to show cost data | Save the project as a Microsoft Excel workbook, and create the chart from the data in Excel. |
| Give a live presentation | Prepare a Microsoft PowerPoint presentation. You can copy data into Word, convert it to a table (Table Ø Convert Ø Text to Table), and copy it into a PowerPoint slide. |
| Provide easy access to the project file for others to review | Post the project to a public Microsoft Exchange folder (File Ø Send To Ø Exchange Folder), or to a web folder (File Ø Save As, and click Web Folders on the Places bar). |
Whether you choose one or all of these methods of communication, other people in your organization will generally benefit from hearing about your team’s experience with a project. This is your opportunity to raise expectations in your organization about what quality project management is all about. Wow them with the quality of your analysis about the project’s successes and failures, and you’ll set yourself apart from the masses, whose projects generally fade away into nothingness.
|
|
EAN: 2147483647
Pages: 241