Analyzing Data with PivotTable and PivotChart Views
In a manner similar to how Excel uses PivotTable reports and PivotChart reports, Access allows you to view and work with data in PivotTable views and PivotChart views. The PivotTable view and PivotChart view toolbars, shortcut menus, and other tools work almost identically to their Excel counterparts. For information about how to create and work with PivotTable reports and PivotChart reports, see Chapter 4.
To create a PivotTable view or PivotChart view of a table, query, or form, open the table, query, or form and then click PivotTable or PivotChart on the View menu. You can then customize the PivotTable view or PivotChart view to fit your requirements.
| Note | PivotTable View and PivotChart View are not available in Access 2000. |
Your Turn
In this exercise, you will create a PivotTable report and a PivotChart report based on the Invoices query.
-
If the
 Northwind.mdb file is not already open, start Access and open the Northwind.mdb file in the Chap05 folder.
 -
On the View menu, point to Database Objects and then click Queries.
-
In the list of queries in the Database window, double-click the Invoices icon.
-
On the View menu, click PivotTable View.
-
From the PivotTable field list, drag the Company Name icon to the Drop Row Fields Here area.
-
In the PivotTable field list, click the Extended Price icon, select Data Area in the drop zone list, and then click Add To.
-
In the PivotTable field list, click the plus (+) symbol next to the Order Date By Month icon and then drag the Years icon to the Drop Column Fields Here area. Compare your results to Figure 5-15.
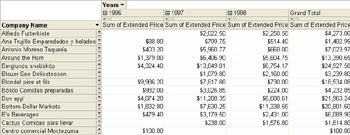
Figure 5-15: PivotTable report based on the Invoices query. -
On the View menu, click PivotChart View.
-
Click a blank area of the PivotChart View.
-
On the PivotChart menu, click Chart Type.
-
Click Area.
-
Click the 3D Area icon, and then close the Properties dialog box. Compare your results to Figure 5-16.
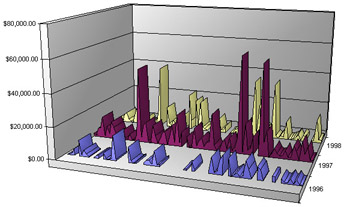
Figure 5-16: PivotChart report based on the Invoices query PivotTable report. (Company names have been removed for clarity.)
As you can quickly see, 1997 was a better year for sales than 1996 or 1998.
EAN: 2147483647
Pages: 137