Querying External Data
You can use a program called Microsoft Query, included with Microsoft Excel, to query certain types of external data and bring the query results into an Excel worksheet for further data analysis. If the external data changes, you can see the updated data in the Excel worksheet. In short, importing extracts a copy of the data, while querying links directly to the data.
| Note | As with external data you import, when you query external data, you cannot save changes that you make to the data in Excel to the original data source. To make changes to the external data, you need to use the application in which the external data originated. |
To query external data and place the query results into a worksheet:
-
On the Data menu, point to Import External Data and then click New Database Query. The Choose Data Source dialog box appears.
-
If your data source is visible on the Databases tab, double-click the data source and go to step 9 below. Otherwise, click New Data Source on the Databases tab and then click OK.
Note If your data is in an OLAP cube stored on a Microsoft SQL Server 2000 Analysis Server computer, see Chapter 8 for details on how to use Microsoft Query to query data in an OLAP cube.
-
In the What Name Do You Want To Give Your Data Source box, type a name for the data source that’s descriptive yet easy for you to remember.
-
In the Select A Driver For The Type Of Database You Want To Access list, select the type of data source from which you want to query data.
-
Click the Connect button. The ODBC Setup dialog box appears.
-
Provide the information in the ODBC Setup dialog box to connect to the data source (the information varies depending on the type of database you want to query), and then click OK to return to the Create New Data Source dialog box.
-
In the Select A Default Table For Your Data Source list, click a table to use as the basis for your database query and then click OK.
-
Click OK in the Choose Data Source dialog box to start the Query Wizard. The Choose Columns page appears.
-
In the Available Tables And Columns list, double-click each column that you want to include in your database query to move the column to the Columns In Your Query list.
Tip Click the Preview Now button to see which data values will be included in the query. Click the Options button to show or hide tables and other database objects, show the objects in alphabetical order, and set other options.
-
Click Next. The Filter Data page appears.
-
You can filter the data to be displayed by clicking a column in the Column To Filter list and specifying filter conditions in the Only Include Rows Where area.
-
Click Next. The Sort Order page appears.
-
Click an entry in the Sort By list to specify a column by which to sort. Click the Ascending or Descending option to specify the sort order.
Tip You can specify additional sorting options by repeating the previous step with the Then By list on the Sort Order page.
-
Click Next. The Finish page appears.
-
Click one of the options: to return the data to an Excel worksheet, view or edit the data in Microsoft Query, or create an OLAP cube from the data that the query returns. Click Finish.
Note When you click the Create An OLAP Cube From This Query option, the OLAP Cube Wizard dialog box appears. For details about how to use the OLAP Cube Wizard dialog box, see Chapter 8.
Tip Click the Save Query button on the Finish page to save the selections that you made in the Query Wizard dialog box to a query file. This query file can then be shared with other users.
Your Turn
In this exercise, let’s assume that you’re receiving data from your hotel chain’s corporate headquarters, where data is stored on a mainframe computer. The data has been exported from the mainframe to a comma-separated value (CSV) format. The CSV file is named ![]() Hotel.csv and is located in the Chap03 folder. You want to see only those records in which customers spent more than $1,500.00 on room service in any one month.
Hotel.csv and is located in the Chap03 folder. You want to see only those records in which customers spent more than $1,500.00 on room service in any one month.
-
Start Excel. If Excel is already running, create a new worksheet.
-
On the Data menu, point to Import External Data and then click New Database Query.
-
On the Databases tab, click New Data Source and then click OK.
-
Name your data source Hotel CSV 2.
-
In the Select A Driver For The Type Of Database You Want To Access list, click Microsoft Text Driver.
-
Click Connect.
-
Clear the Use Current Directory box, and then click Select Directory.
-
Select the Chap03 folder, and then click OK. Note that you cannot select the
 Hotel.csv file in this step. You will select it in the next step.
 -
Click OK in the ODBC Text Setup dialog box, and then click
Hotel.csv in the Select A Default Table For Your Data Source list. -
Click OK to return to the Choose Data Source dialog box.
-
On the Databases tab, click Hotel CSV 2 and then click OK.
-
Double-click the available columns to move them to the Columns In Your Query list.
-
Continue clicking Next on the rest of the wizard’s pages, specifying any filtering and sorting options that you want, until you get to the Finish page.
-
Click the View Data Or Edit Query In Microsoft Query option, and then click Finish.
-
On the Criteria menu, click Add Criteria.
-
In the Field list, select Total Room Service.
-
In the Operator list, select Is Greater Than.
-
In the Value box, type 1500.
-
Click Add, and then click Close. Your results should look similar (although perhaps not exactly the same as) Figure 3-15.
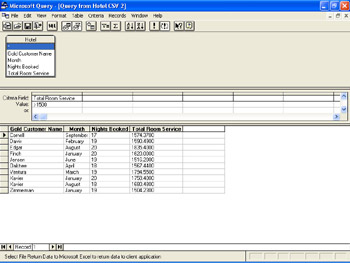
Figure 3-15: The Microsoft Query user interface, where filter criteria can be added. -
Click the Return Data button, and then click OK to place the data into the existing worksheet. Your results should look similar to Figure 3-16.
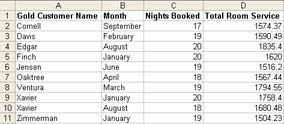
Figure 3-16: Microsoft Query data returned to Excel.
Querying Data on the Web
You can query data imported from a Web site just like you can other types of external data. For example, you may want to query sales data on your organization’s intranet site and do further data analysis on the sales data in Excel. For the best query results, the Web-based data should be displayed in a row-and- column format similar to an Excel spreadsheet.
| Note | The appearance of the New Web Query dialog box and the steps to configure the dialog box are different in Excel 2000 and Excel 2002, but the end result is the same. |
| Tip | As with other types of external data, when you query data imported from a Web site, you cannot save changes that you make to the Web-based data in Excel to the original data source. To make changes to the original data, talk to the Webmaster or Web site administrator to see which application to use and to obtain any necessary permissions. |
To query Web-based data, click the cell in the spreadsheet where you want to insert the first item of data. On the Data menu, point to Import External Data and then click New Web Query. In the Address box, type the address for the data and then click Go. The Web page containing the data appears. Click the arrows next to the data tables that you want to query, click the Import button, and then click OK.
Your Turn
In this exercise, you will import a list of preferred customer information from your hotel chain’s Web site. For simplicity’s sake, you will use the ![]() Hotel.htm file, located in the Chap03 folder, as the Web page containing the information.
Hotel.htm file, located in the Chap03 folder, as the Web page containing the information.
-
Start Excel. If Excel is already running, create a new worksheet.
-
On the Data menu, point to Import External Data and then click New Web Query.
-
In the Address box, type c:\Microsoft Press\Excel Data Analysis\Sample Files\Chap03\Hotel.htm (or the path for the location where you copied the book’s sample files) and click Go. Compare your results to Figure 3-17.
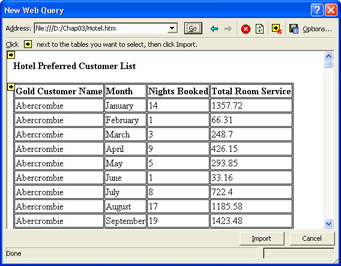
Figure 3-17: The New Web Query dialog box. -
Click the arrow next to the Gold Customer Name field. Compare your results to Figure 3-18, and then click Import.
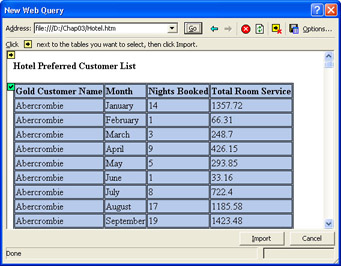
Figure 3-18: Selecting the preferred customer data table. -
Click OK to display the data in the existing worksheet. You can now begin analyzing this data as you would analyze data on any other Excel worksheet.
EAN: 2147483647
Pages: 137