Pivoting Data
Pivoting data is a relatively straightforward concept to grasp, but drawing real- world analogies to the concept is somewhat difficult. When you think of the word pivot, you might think of a door pivoting on its hinges, using your pivot foot during a basketball game to avoid a traveling penalty, a wheel pivoting on an axle, and so on. In all of these cases, something is moving around a fixed object. In data analysis, when you pivot data, a particular data field is fixed and other data facts move around the fixed field. Although you will practice several exercises in Chapter 4 and Chapter 6 to understand pivoting data, here is an exercise to introduce you to this very powerful data analysis technique.
Your Turn
This exercise demonstrates the use of PivotTable reports.
-
In the
 CustServ.xls file (located in the Chap02 folder), display the PivotTable Report worksheet. Notice that the Average Of Cashier data value for all years is 3.68.
 -
In cell B1, click the arrow, select 1999 from the list, and then click OK. The data values now reflect only the values for 1999. The Average Of Cashier data value changes to 3.74.
-
Click cell A1, hold the mouse button down, and drag the pointer to between cells A4 and B4. When the pointer is displayed as an I-beam, as shown in Figure 2-8, release the mouse button. As Figure 2-9 illustrates, you can now see the average data values by year and by measurement category.
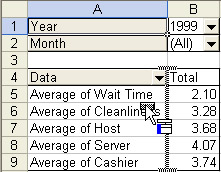
Figure 2-8: Dragging the Year data field to another location in the PivotTable report.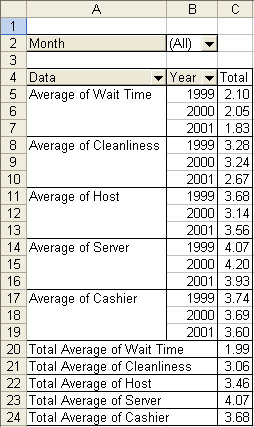
Figure 2-9: The results of dragging the Year data field to another location in the PivotTable report.
You can summarize and filter data values by using PivotTable reports.
EAN: 2147483647
Pages: 137