Front and Center: More Ways to Look at Data
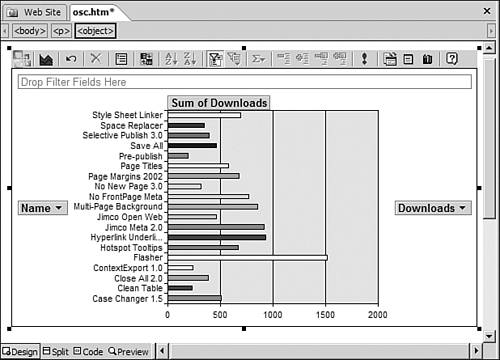
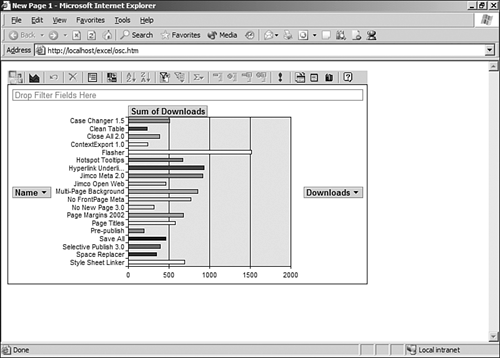
| The Office Spreadsheet Web Component is just one of three Office Web Components that provides access to Excel data. There is also an Office Chart component and an Office PivotTable component both of which provide the same amount of interactivity as the Office Spreadsheet Web Component. The Office Chart component (shown in Figure 40.25) makes it easy to provide users of your Web site with interactive charts populated with data from an external data source or another Office Web Component on the same Web page. Figure 40.26 shows the same Office Chart component running inside a Web page. Notice that the toolbar provides much of the same functionality in the browser that you have when using a chart in Excel or other Office products. Figure 40.25. The Office Chart component creates dynamic charts for display on your Web site.
Figure 40.26. The Office Chart component running inside a Web browser. Notice the toolbar providing advanced options right within the browser.
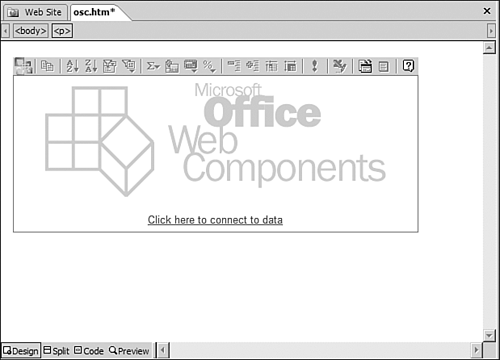
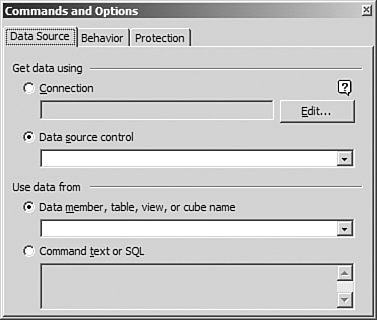
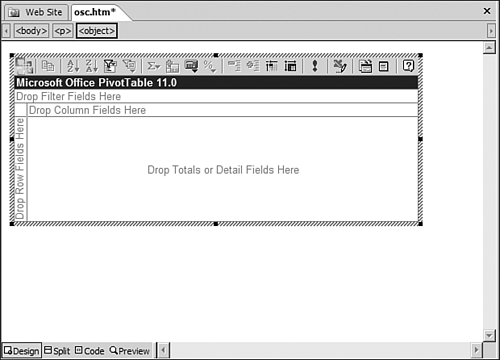
The Office PivotTable component is the most powerful Office Web Component of the three, and along with that power comes a considerable amount of complexity. Users of Excel spend a great deal of time learning how to use a PivotTable, and most users never fully grasp the power and function of this feature. A PivotTable presents data so that it can be manipulated and massaged to show you exactly what you need. It essentially allows you to build a spreadsheet on-the-fly based on what fields you choose to display from a particular data source. You can configure how the data is grouped and how much of it is displayed. Until you use a PivotTable, the concept of it is hard to understand. Figure 40.27 shows what an Office PivotTable component looks like when it's first inserted. Note the link that says Click here to connect to data. When you click that link, the Commands and Options dialog box is displayed and the Data Source tab is selected as shown in Figure 40.28. Once you configure a data source, the Office PivotTable component changes to look like the one shown in Figure 40.29. Figure 40.27. The Office PivotTable component without any data connections configured.
Figure 40.28. The Commands and Options dialog box provides the interface to connect the Office PivotTable component to data.
Figure 40.29. This Office PivotTable component is connected to a data source and is ready to be populated with data.
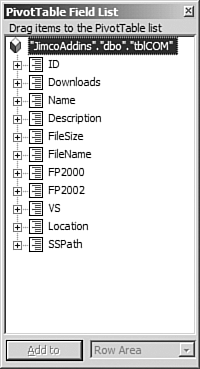
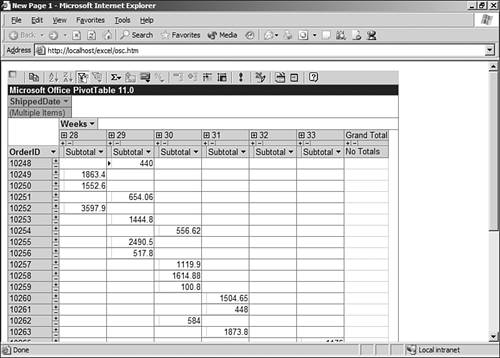
To populate the Office PivotTable component with data, right-click on it and select Field List from the menu to display the PivotTable Field List dialog box shown in Figure 40.30. Figure 40.31 shows a PivotTable component configured to show sales data for a particular period. By dragging and dropping fields from the Field List, changing the data that is displayed and how it is being displayed is very easy. Figure 40.30. The PivotTable Field List allows you to choose what data is displayed in your PivotTable component.
Figure 40.31. This PivotTable shows a complex view of sales data. Getting this kind of view would be nearly impossible without a PivotTable.
|
EAN: 2147483647
Pages: 443