Front and Center: Debugging
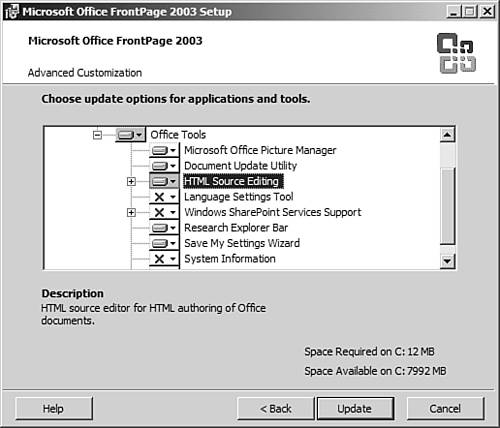
| So far, the assumption has been that all the JavaScript you're entering will run without problems. As long as you enter it correctly, it will, but that's because I've already debugged it for you! In the real world, code almost never runs successfully on the first try. Sometimes you get lucky and your code runs without debugging, but almost all code requires some level of debugging in order to get the desired results. There are two types of problems you can encounter with code syntax errors and logic errors. Syntax errors are often the easiest errors to resolve. For example, the following line of code will generate an error: document.Write('Welcome!'); Remember, JavaScript is case sensitive. The write method does not start with a capital W, so when this line executes, it will generate an error. Logic errors are much harder to track down. A logic error occurs when code is written so that it will run without syntax errors, but the code produces undesired results. Logic errors are hard to track down because when an error occurs, it will often point you to a part of code that is nowhere near where the actual error is located. Suppose, for example, you have a function that returns a specific numeric value and that function contains a logic error. You have code in a completely different area that relies on the number returned from the function. When the code runs and an error occurs, the error message might point to the section of code that is using the number returned from the function, not the function itself. There are many approaches to debugging JavaScript code. Some people use the JavaScript alert method to display messages at certain places in code. For example, if a function returns a specific numeric value, you can place an alert method at the end of the function call and display the value the function returns as shown in the following code example: function debugTest() { var i; i = document.getElementById('txtYears').value; alert(i); return i; } When this function runs, an alert dialog box will display indicating the value of i. This method of debugging can help in some situations, but it is far more useful to use a debugger so that you can execute code in a controlled way and examine values as you progress through it. FrontPage offers just such a debugger in the Microsoft Script Editor. To use the Microsoft Script Editor, open a Web page in FrontPage that contains client-side script and then select Tools, Macro, Microsoft Script Editor. If the Microsoft Script Editor menu option is not enabled, you will need to install HTML Source Editing, an option in your FrontPage installation (see Figure 24.5). If HTML Source Editing is already installed, you might still have to install the Script Editor, but FrontPage will prompt you to do so when you click the menu item. Figure 24.5. The HTML Source Editing component of FrontPage must be installed to use the Script Editor.
Once the Script Editor is installed, you will still need to install Web Debugging in order to use the debugging feature. To install it, select Debug, Install Web Debugging from within the Microsoft Script Editor. Once Web Debugging has been installed, you are ready to start debugging.
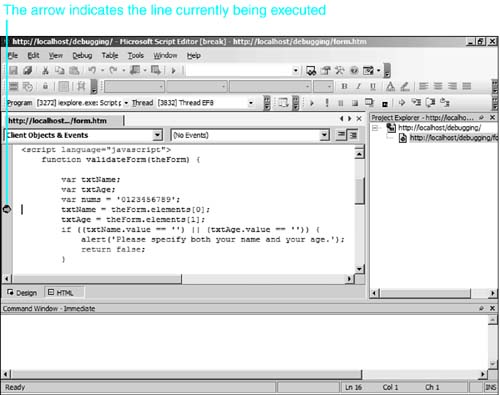
When you submit the form, the debugger will break on the validateForm function as shown in Figure 24.6. Note that the debugger does not stop at the very first line. Certain lines are not valid breakpoints because they do not execute any code. If you set a breakpoint on an invalid line, the Script Editor will break on the first valid line after your breakpoint. Figure 24.6. The debugger has stopped and is waiting for you to execute the next line of code.
The three primary methods of continuing execution of your code are as follows:
While the debugger is sitting on a breakpoint, it is very easy to examine the current state of your script. The Locals Window is the most convenient way to analyze the variables in your script. In Figure 24.7, you can easily see the variables that were declared in the validateForm function. Note that theForm, txtAge, and txtName all have a plus sign next to them. By clicking the plus sign, you can analyze all the properties of each of those variables. For example, by clicking the plus sign next to txtName, you would be able to look up the value property to see what text was entered into that text box. Figure 24.7. The Locals Window provides details on all variables in one place.
The Help file for the Script Editor contains details on all the tools available to you to make debugging your scripts easy. By utilizing the powerful debugging tools that the Script Debugger offers, you can spend more time writing new scripts and less time fixing problems in existing scripts. |
EAN: 2147483647
Pages: 443