10.3 Performance management
As I stated earlier, performance management involves the monitoring and management of system performance and capacity characteristics to ensure that performance and delivery service levels are achieved. This involves establishing performance baselines to compare observed statistics.
Performance management also includes the capacity-planning functions critical to anticipating growth. Performance management of your Exchange deployment is a critical part of ensuring mission-critical reliability. You may have taken all possible disaster-recovery measures to ensure that your messaging system is up and running, but if you are not aware of how your system is performing, you can leave yourself open to a myriad of downtime woes. Performance management involves three key activities:
-
Performance monitoring and data collection
-
Performance baseline definition
-
Performance detection, diagnosis, and correction
10.3.1 Performance monitoring and data collection
In this activity, key performance indicators for both the operating system (Windows Server) and the application (Exchange Server) are monitored and collected in a management repository. To understand exactly how user demands on a system like Exchange are translated into server load, you must collect performance data. This process is usually carried out over an extended period across all or a sampling of the servers in your Exchange deployment. Once collected, this data must be analyzed in order to explain how the Exchange server responds to user activities. I recommend that you carry out your monitoring on a scheduled periodic basis that allows you to identify tends in server performance. The data collection process should continue throughout the life of your Exchange deployment. For an Exchange 2000/2003 server, there are several critical areas for which monitoring and data collection need to occur. Table 10.2 lists the server hardware subsystems and describes their importance to achieving optimal performance for Exchange 2000/2003. Table 10.3 lists and describes the key monitoring points for Exchange Server.
| Server Subsystem | Windows Object | Counter | Description | Guideline |
|---|---|---|---|---|
| System memory | Memory | Pages/s | Pages/s refers to the number of pages read from or written to disk to resolve hard page faults. It is the sum of Memory: pages input/s and Memory: pages output/s. | Average < 10 |
| Page faults/s | Page faults/s refers to the overall rate at which the processor handles faulted pages. It is measured in numbers of pages faulted per second. | Dependent upon application and system characteristics | ||
| Available bytes | Available bytes refers to the amount of physical memory available to processes running on the computer, in bytes. It is calculated by summing space on the zeroed, free, and standby memory lists. | > 4 MB | ||
| Free system page table entries | Free system page table entries refers to the number of page table entries not currently used by the system. | > 5,000 entries | ||
| Committed bytes | Committed bytes refers to the amount of committed virtual memory, in bytes. | Average < 80% of physical memory | ||
| Disk subsystem | Physical disk | Average disk queue length | Average disk queue length is the average number of both read and write requests that were queued for the selected disk during the sample interval. | Average < the number of spindles in volume |
| Current disk queue length | Current disk queue length is the number of requests outstanding on the disk at the time the performance data is collected. | Frequent returns to ~0 | ||
| Average disk s/read | Average disk s/read is the average time in seconds (ms) of a read of data from the disk. | Average < 20 ms (may vary by storage system) | ||
| Average disk s/write | Average disk s/write is the average time in seconds of a write of data to the disk. | Average < 10 ms (may vary by storage system) | ||
| Disk reads/s | Disk reads/s is the rate of read operations (I/Os) on the disk. | Dependent upon spindles in disk volume | ||
| Disk writes/s | Disk write/sec is the rate of write operations (I/Os) on the disk. | Dependent upon spindles in disk volume | ||
| Processor subsystem | System | Processor queue length | Processor queue length is the number of threads in the processor queue. | Average < 5 times number of CPUs |
| Context switches/s | Context switches/s is the combined rate at which all processors on the computer are switched from one thread to another. | Average < 20,000/s; dependent upon application and system characteristics | ||
| Processor | Percentage processor time | Percentage processor time is the percentage of time that the processor is executing a nonidle thread. This counter was designed as a primary indicator of processor activity. | Average < 60%–80% | |
| Interrupts/s | Interrupts/sec is the average number of hardware interrupts the processor is receiving and servicing in each second. | Dependent upon application and system characteristics | ||
| Network subsystem | Network interface | Bytes total/s | Bytes total/s is the rate at which bytes are sent and received on the interface, including framing characters. | Dependent upon application and system characteristics |
| Output queue length | Output queue length is the length of the output packet queue (in packets). | Average < 2 |
| Exchange Object | Counter | Description | Guideline |
|---|---|---|---|
| MSExchangeIS | RPC requests | The number of client MAPI RPC requests currently being processed by the store process | Max < 100 |
| RPC operations/s | The number of MAPI RPC operations per second that the Exchange store is processing | Baseline average < 20 | |
| VM largest block size | The largest contiguous block of virtual memory available to the store process. | > 60 | |
| MSExchangeIS Mailbox | Client average RPC latency | The MAPI RPC latencies experienced between client and Exchange server. | Baseline |
| Client maximum elapsed RPC time | The maximum time an RPC take to complete | Baseline | |
| Client RPC failed operations | The number of MAPI RPC failures that have occurred between the client and Exchange Server | Baseline | |
| Folder opens/sec (per information store database instance) | The rate at which requests to open folders are submitted to the information store | Baseline per database | |
| Message opens/s (per information store database instance) | The rate at which requests to open messages are submitted to the information store | Baseline per database | |
| Messages submitted/ min (per information store database instance) | The rate that messages are submitted to the information store by clients | Baseline per database | |
| Send queue size (per information store database instance) | The number of messages in the information store’s send queue | Baseline per database |
From a performance and server-resource perspective, perhaps the most important process on your Exchange server is the information store process (one could argue that the SA is more important since everything in Exchange relies on this process). STORE.EXE provides both the underlying Exchange database engine (Extensible Storage Engine, or ESE) and the interface between user and data. Therefore, it is critical that performance of the information store be constantly monitored and managed. Problems with performance here will result in slower response times and increased message delivery times. It is vital that this process be on-line and operating at optimum performance.
Important to server performance monitoring and data collection is an understanding of response time versus throughput. A user’s perception of server performance could be viewed as response time. For example, how long does a user have to wait after double-clicking a mail message until the message opens for reading? If a server is heavily loaded and has diminished resources, the response time will be longer, which furnishes a direct correlation between server resource bandwidth and server load conditions. Response time is an important measurement for servers that are directly supporting user functions such as mail, scheduling, and public folder applications. Luckily for Exchange administrators, Microsoft added some important functionality in Exchange 2003 Server and Outlook 2003 to provide client response time and RPC tracking metrics that directly demonstrate client/server response time. Additionally, with cached-mode operation of Outlook 2003 and Exchange 2003, it is unlikely that clients will even know when they are experiencing poor response times from the server.
Throughput, on the other hand, is typically important for servers performing background activities such as message routing, public folder replication, or SMTP gateway functions. For example, in a bridgehead server environment, throughput measurements such as messages per second or bytes per second are more relevant measurements of server performance than response time. Throughput can also be an important performance measurement for mail servers supporting heavy user loads.
As you are monitoring server performance, it is important to understand bottlenecks. Bottlenecks occur in server subsystems such as the processor, memory, and disk subsystems. They are, simply, the resource subsystems with the high demand. Bottlenecks are often closely interrelated since the presence of one bottleneck can mask another bottleneck at the resource with the next-highest demand level. Furthermore, a bottleneck in one resource may prevent another resource from being fully utilized. For example, the processor subsystem will be delayed from completing tasks when a disk subsystem is being taxed beyond its capacity—resulting in low processor utilization. The resulting low processor utilization is due to the processor waiting for disk I/O to be completed, but the processor is not the bottleneck—the storage system is.
Use of a performance-monitoring tool such as System Monitor or thirdparty management applications is critical to successful performance-management activities. Make sure you know how to use these tools. System Monitor, for example, will often cause you to miss valuable information as a result of improper capture or monitoring intervals. For example, when logging or graphing performance characteristics of disk queue length or reads per second for a disk subsystem, you may capture the update interval for time periods that do not present a true picture of disk subsystem performance. With an interval of 30 seconds, for example, the data may appear well within subsystem capacities (such as disk queue length is below 2). When the capture interval is changed to 5 seconds, however, it may be revealed that the resource is experiencing peak periods of utilization that are masked by the longer 30-second update interval. Resources such as the disk subsystem often experience spikes due to such things as load or write-back cache flushing. Thought should be given to the scale used when analyzing server performance. A graph scale that misrepresents the actual performance data has misled many an analyst.
The following are two rules of thumb:
-
Performance data should be viewed alongside similar data. For example, comparing processor utilization measured in percentages with system memory consumption measured in bytes could be confusing since different scales are represented.
-
Performance data should be viewed with a proper understanding of the sampling period (graph time) and the graph time window. When looking at time-related performance data, careful consideration of the time period sampled is important to proper analysis of the data. For example, when viewing a counter such as messages per minute, it is important to have a sample period of sufficient extent to justify conclusions.
The process of performance monitoring and data collection needs to be an established practice for your Exchange deployment. Without it, it is difficult to provide proactive management of your environment. The mistake that some organizations make is to monitor servers only after they experience performance problems or on an exceptional basis. Make this an established operation that takes place for every server in your Exchange deployment. Using the data you collect, you can make critical decisions that will impact your ability to provide the levels of service required by the business objectives of your organization.
10.3.2 Performance baseline definition
Once you have collected performance-monitoring information for your server subsystems, operating system, and Exchange server, the process of defining baseline performance thresholds in support of your SLAs and healthy system operation can be defined. These thresholds are based on the server workload characteristics observed for the collected performance data. You will need to make decisions about what thresholds are necessary based on both client- and server-side measurements. Most likely, it will be obvious if these thresholds are set incorrectly. Performance thresholds that are set too low will generate necessary alerts for your operations staff as they are proactively attempting to manage the performance of Exchange servers. The more important concern is thresholds that are set too high; this will most often result in performance problems that go undetected to the system administrator while aggravating clients. By the time system managers become aware of the problems, it will be too late and performance management will shift to a reactive mode. Microsoft and third-party experts have provided a number of useful thresholds. However, for some performance metrics, you will need to conduct the monitoring and data-collection process on your own to set logical thresholds for your specific deployment (this is called performance baselining). The level of system performance for your Exchange servers that you consider acceptable when your system is handling a normal workload becomes your baseline. A baseline is a very subjective standard and may correspond to a range of measurements and values.
10.3.3 Performance detection, diagnosis, and correction
Once performance management baselines have been established, you will need to devise methods to monitor and alert you to impending problems and to provide rapid resolution before these problems impact system users. Once a performance problem has been detected, quick identification of the root cause is necessary in order to resolve the issue. Just as you establish processes and procedures for disaster recovery, so should you develop and implement them for performance management. Again, this may require some additional investment in the time and expertise to develop these procedures as well as an investment in training for your operations staff. Using the thresholds you have defined based on your data collection and characterization exercises, you must use the tools at your disposal and configure performance alerts and notifications based on those thresholds. For example, if you baseline a particular monitoring point, such as messages per second, you need to determine both high and low thresholds that will signal system problems. A low rate of messages per second through an SMTP connector may point to other problems such as network bandwidth issues. A high rate may just be an indication of increased system activity or could be a warning of a DoS attack (citing an extreme case). Regardless of the thresholds you set, they must be well thought out and not generate unnecessary alarms or let potential early warning signs go unnoticed.
The tools you employ may cost a fee or be free. There are many great third-party management tools for Windows and Exchange that come with built-in “knowledge scripts” or “knowledge modules.” These built-in components give you a head start and take the guesswork out of performance management threshold definition. I will discuss Microsoft Operations Manager, or MOM, later in this chapter and how this tool can be leveraged for proactive Exchange Server management. Of course, most of these tools also allow you to customize the configuration based on the needs and service levels for your Exchange deployment. Windows Server provides its own means to give you some of the same functionality of these tools, but does not come close to the features provided by third-party tools such as NETIQ AppManager and BMC Patrol. Windows provides this functionality by combining the Computer Management MMC snap-in (in previous versions of Windows NT, this was provided as a separate application— Windows NT Performance Monitor) and the System Monitor tool. The Computer Management snap-in provides the Performance Logs Traces and Alerts system tool. Within this tool, three objects are available—counter logs, trace logs, and alerts. Within the System Monitor ( Perfmon.exe ), you can view real-time system performance data or utilize data from counter and trace logs defined by the Computer Management tool (shown in Figure 10.2). These tools can be used as a complement to third-party management tools or MOM.
The final phase of the performance-management and monitoring process is the correction of performance problems. Problems that are correctable fall into two categories: on-line and off-line corrections. On-line corrections are those that can be completed while the system is up and running. Examples of on-line performance corrections including stopping services, processor affinity tuning (Windows Process Monitor), or dynamic memory allocation (Exchange Server uses dynamic buffer allocation). Off-line performance corrections are those that require that the server be shut down in order to perform hardware upgrades or reallocation operations to address the performance issue. These include adding additional processors, memory, and disk drives. For Exchange Server, the most common performance bottleneck is disk I/O. By identifying hot volumes via performance monitoring and diagnosis, you may decide to add more spindles to a particular volume. Whatever your approach to performance-problem resolution, you need to ensure that you have a clear understanding of how each individual server subsystem impacts Exchange Server performance. This requires personnel with expertise in both hardware and Exchange Server. When you are planning for performance management of your Exchange servers, don’t forget to address every aspect, including performance monitoring and data collection, performance baseline definition, and performance detection, diagnosis, and correction.
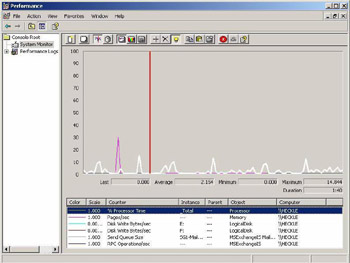
Figure 10.2: Performance monitoring with Windows Server System Monitor.
EAN: 2147483647
Pages: 91