Constructing Class Diagrams
Your class diagrams show the fixed structure of classes, objects, attributes, operations, associations, generalizations, and aggregations. (See Chapters 3, 4, 5, and 6 for more on these items.) If you’re engaged in a large modeling or development project, building one large class diagram for the whole project isn’t helpful—classes get lost, the diagram becomes confusing and difficult to read—break that diagram up into manageable pieces. You want to be consistent in your diagrams as well. A class diagram should have the same time period reflected in each association. (You may also find it helpful to build diagrams that have only instances of classes, but this is rare.)
Drawing manageable class diagrams
We have seen many developers draw impossibly large diagrams using the development notation of the day. Some of these diagrams fill entire walls. These diagrams can be difficult to understand because the important information was buried in amongst hundreds of unimportant details. To make our diagrams comprehensible we break them up into smaller more understandable pieces.
It’s more effective to use a simple process to get more bite-size diagrams. To illustrate this process we use the example of a company that’s in the business of selling air-filter units to customers and buying stock from their suppliers. The process is as follows:
-
Build one top-level diagram with up to 15 key classes.
The top-level diagram provides developers with an overview of the most important classes. It avoids showing details. The key classes are those groups of objects that are most important to your business; they may include classes such as customer, air filter, and supplier.
-
Build second-level diagrams with one of the key classes in the center of the diagram surrounded by 5 to 10 supporting classes and their association with the key class.
Now you choose one of the key classes from the top-level diagram. Add in details showing attributes, operations, other supporting classes, and associations that directly relate to the chosen key class. For example, build a class diagram with customer at the center, showing supporting classes such as coupon, customer account, credit card, and club card.
-
If you have a significant aggregation, show the aggregate and its parts on a separate diagram.
The class playing the role of the whole (aggregate) should appear on the top-level diagram or on one of the second-level diagrams. For example, you show the air filter and its parts on one diagram.
-
When you have a significant inheritance hierarchy, place the superclass and its subclasses on a separate diagram.
See Chapter 6 for more on inheritance.
From our running example, you have many types of coupons. On a separate diagram, show the generic coupon as a superclass and the different types of coupons as subclasses.
-
If any of your second-level diagrams are too complex with more than ten supporting classes, consider creating a third level of class diagrams.
When you follow this process, you get a hierarchy of class diagrams; each diagram has a specific focus. Stakeholders and users who want a quick overview look at your top-level diagram. Figure 7-2 shows just such a diagram for a simple retail system that handles customer orders. Notice that the top-level diagram just shows the most important classes, without specifying their attributes or operations. The top-level diagram should be simple, without much detail to clutter it up.
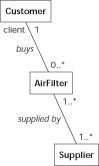
Figure 7-2: A top-level diagram.
Tip Each class diagram should have a single major theme—and should have no more than 15 to 20 classes. People have a hard time remembering more than a half-dozen things in their short-term memory. So if you put 20-plus classes in one diagram, most people will find it confusing and difficult to work with. We talk about a top-level diagram followed by a second-level diagram. If a class on the second level also has a lot of supporting classes, you can create third-level diagrams. Try to keep the number of classes on any one diagram below 20 classes.
You see a second-level diagram in Figure 7-3 with the focus on a Customer class. All the classes that relate to Customer are shown. Developers interested in all aspects of Customer turn to this diagram to see the details. Users and developers in a specific area of your business should be able to review the diagrams that focus on their areas of expertise. They should not have to look over every class in your system to find those that interest them.
Notice that the second-level diagram in Figure 7-3 shows details such as the attributes and operations for Customer and all its supporting classes—ClubCard, CreditCard, CustomerAccount, and Coupon. Sometimes we place other top-level classes on a second-level diagram because other developers need to see how the details of a key class fits into the big picture shown in the top-level diagram. For example, the second-level diagram shows the Customer class associated with the AirFilter class so you can understand the context of the customer focus diagram and its relationship to the higher-level diagram. The AirFilter class is shown without attributes and operations. To account for them, we would provide another, second-level diagram with AirFilter at the center, and show its supporting classes.
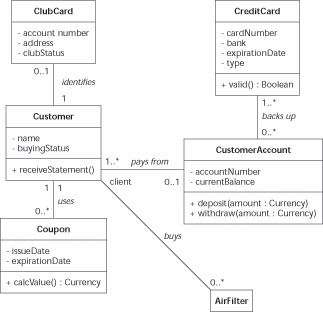
Figure 7-3: A second-level diagram.
Figure 7-4 shows you the details of the AirFilter class. This diagram focuses on the internal parts of the air filter. You notice that the diagram isn’t cluttered with other classes outside of the AirFilter class.
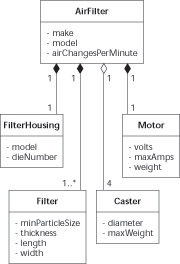
Figure 7-4: Separate aggregation diagram.
The class diagram in Figure 7-5 gives your developers a way of focusing on an inheritance hierarchy without having to wade through the complexity of other classes and associations.
Remember Keep the following in mind when deciding what to put in a class diagram:
-
Don’t try to put every class on one diagram.
-
Create a top-level diagram with your 5 to 15 key classes.
-
Think of each class diagram as having a theme—all the classes in the diagram support that theme.
-
Provide second-level diagrams. Each second-level diagram focuses on one or two of the key classes shown in the top-level diagram.
-
Create separate class diagrams that show only an aggregate and its parts
-
Put inheritance hierarchies into their own class diagrams.
Figures 7-2, 7-3, 7-4, and 7-5 begin to capture the language of an air-filter order system. Users of that system understand what a coupon is. They can look at Figure 7-4 and tell you whether you have captured all the different kinds of coupons. These four figures are known as a domain diagrams because they describe the domain of ordering air filters in a retail setting.
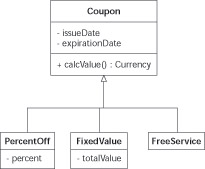
Figure 7-5: Separate inheritance diagram.
Considering time in class diagrams
When you draw a class diagram with its classes and its associations, the diagram is tied to a time period. This sounds odd because of the static nature of these diagrams. But, when you think about the multiplicity of an association you must specify it for some time period. Check your diagram to see that all the multiplicities are for the same time period.
Warning You might create a class diagram with hidden assumptions about time period. All the multiplicities on a class diagram should reflect one time period. If you draw a diagram with more than one time period, you create confusion about what you mean—which leads to poor programming down the road.
Figure 7-6 shows a class diagram with two different time periods, and the multiplicities used in the diagram are tied to that fact. The supplier may or may not send an invoice according to the sends association, and to represent that, we have used the 0..1 multiplicity. It’s certainly true that a single supplier sends many invoices over a long period of time, say five years. We chose the 0..1 multiplicity because we’re focused on a very short time period—today—with a current outstanding invoice that must be paid. The diagram in Figure 7-6 also shows that invoices are paid from a supplier account. It shows that a supplier account pays for zero or more invoices. The paid from association also has a time period—for all time or for a very long time period. The paid from association isn’t focused on just the outstanding invoice from a specific supplier.
The problem with the diagram in Figure 7-6 is that it uses two different time periods. Readers of the diagram would not necessarily catch that—and would become confused. The diagram could be interpreted as meaning that a supplier only ever sends one invoice.
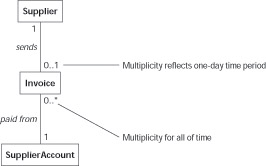
Figure 7-6: A diagram with mixed time periods.
Tip Assign each of your class diagrams a time period. Then check the multiplicity of each association to make sure it conforms to your chosen time period.
If you can’t avoid showing different time periods on the same diagram, you can use role names on your associations to help keep the time periods distinct. Create an association for each time period you plan to use, and then add a role name to indicate the time period for that association.
Figure 7-7 shows the two time periods that were hidden in Figure 7-5. The supplier sends an invoice that plays the role of the current bill. We show this with a sends association connecting the Supplier class with the Invoice class and a currentBill role name. The supplier is also associated with all past sent invoices. This second association adds the second time period of the past to the diagram. We associate the Supplier class with a second association to the Invoice class and a pastBill role name. The paid from association between the SupplierAccount class and the Invoice class remains unchanged.

Figure 7-7: Multiple time periods modeled correctly.
Tip If you make an assumption about the time period for a class diagram, you should add a comment to the diagram. That way you tell other developers exactly what to expect when reading the multiplicities of the associations between the classes.
EAN: 2147483647
Pages: 193