IE Developer Toolbar
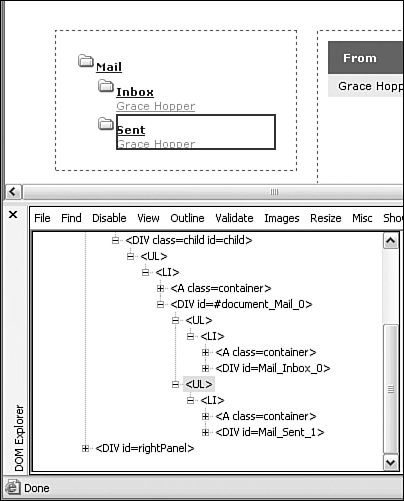
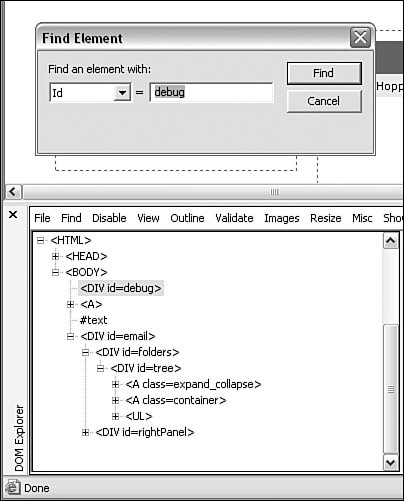
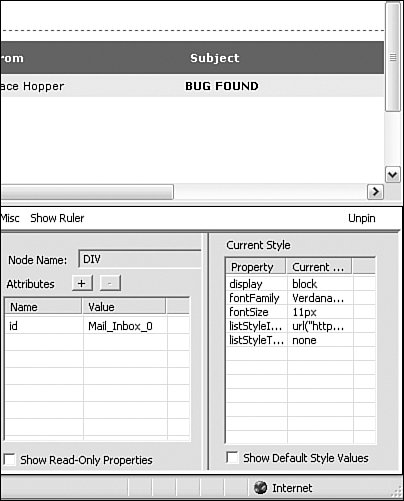
| The IE Developer Toolbar is quite helpful when debugging web applications in Internet Explorer, especially because the built-in JavaScript error console is incredibly vague and unhelpful. In this chapter, we will discover how this tool provides us with the power to disable the cache, navigate the DOM, and view class and id information within the browser. Before we learn how to use each of these features, we will first need to install the plug-in. Installing the Plug-inThe IE Developer Toolbar can be downloaded from http://www.microsoft.com/downloads. After you have downloaded and installed the toolbar, it is quite simple to get started. Go to the View menu and select Toolbars, Developer Toolbar. This will provide us with the toolbar at the top of IE. After we have the toolbar set up, we can either click View DOM, or go to the View menu and select Explorer Bar, IE DOM Explorer from the drop-down. These options provide us with the DOM Explorer, which we can use for a number of debugging purposes, all of which we will talk about now. Disabling the CacheOne of the most helpful debugging features is the option to disable the cache, which I am sure will make your day if you have been testing applications in IE for any length of time. IE's cache has always been hard to test around, and the process of clearing it takes too many clicks, a long wait time, and is not very reliable. This option can be set by selecting the Disable option from the toolbar and choosing Cache from the various options within the drop-down menu. With this option set, we will never have to clear the cache again, but one thing to keep in mind is that we must reset this option every time we restart IE because it does not save the setting. Navigating the DOMAnother useful feature in the toolbar is the ability to navigate the DOM. The DOM Explorer allows us to view all the tags within a web application, by simply choosing the View DOM button from the toolbar. We will see a tree view on the left side of the DOM Explorer, which represents the structure of the document that is currently active within the browser. We can then navigate the DOM by selecting the plus/minus symbols next to each tag. As we choose different items in the structure, we will get an obnoxious, flashing blue border around the tag that we are selecting in the display. This obnoxious border is actually pretty helpful because it helps us find elements in the page by navigating the HTML. Another feature in the DOM Explorer view is that each time an element is selected, it shows the attributes and the styles for the tags by name with their current values. Take a look at Figure 8.2 to get an idea of what the DOM Explorer looks like. Figure 8.2. Navigating the DOM can help discover issues that arise during runtime. When viewing the entire DOM in most applications, it can get quite convoluted and near impossible to locate elements. This is why the Find Element option is so useful. This option can be found by choosing Find from the DOM Explorer and selecting Find Element from the drop-down menu. Once open, we can search for any element in the page, the options are Element, Class, Id, and Name. Figure 8.3 shows an example of the Find Element option in action. Figure 8.3. Finding specific elements in the DOM doesn't have to be hard. The tree view is one of three panels that appear in the DOM Explorer; the other two are a node attributes panel and a styles detail panel. The node attributes panel displays attribute information about each node. It also enables us to add or subtract attributes as an additional debugging feature. The styles panel contains the style details about each HTML tag in the tree view. While navigating the tree view, each tag that we choose will display its style details in the style panel. Take a look at Figure 8.4 to see both of these panels in action. Figure 8.4. Node attributes and styles. Viewing Class and ID InformationThis feature of the toolbar is simple: It provides us with the ability to view class and ID information. This is a great way to gather information about a web application. If we are having trouble discovering where specific elements are nested within a page, we can use this feature. |
EAN: 2147483647
Pages: 129