Diagnosing Hardware Problems
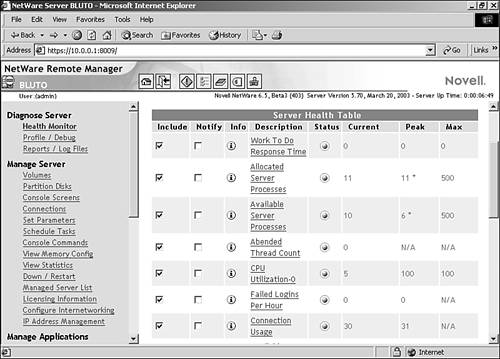
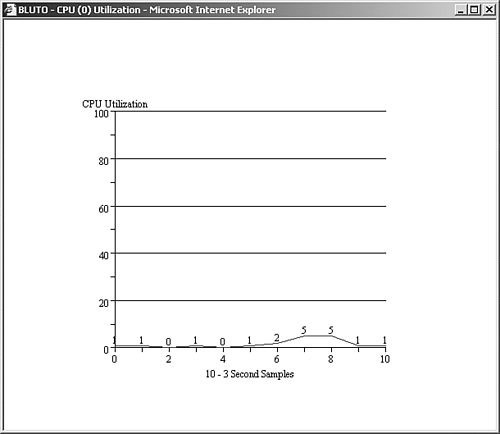
| It's pretty easy to diagnose a hardware problem once a device has completely died. The fact that a network interface card that has been working is suddenly showing no activity light on the back of the card might be a pretty good indication that the NIC is shot. And when you fire up a server in which a drive has gone belly up or the video card has gone bad, the system BIOS will usually alert you to a major hardware problem and provide a series of beeps as a tip off. An important part of troubleshooting a network is actually avoiding troubleshooting major hardware problems by staying one step ahead of the potential hardware pitfalls. Most network operating systems will help you keep track of hardware performance. Not only can you monitor hardware devices such as the drives on a server, but you can also discern the relative health of the network itself using various network-monitoring software. In the Windows environment, you can monitor server hardware performance, such as the processor and RAM, using a tool called Performance Monitor, and network performance can be tracked using a tool called Network Monitor. Novell provides the NetWare Remote Manager, which can be used to view server logs and also quickly check the health of the server. The Health Monitor (accessed via the NetWare Remote Manager) provides a snapshot of the server's health in a table format (see Figure 19.4). Figure 19.4. The Health Monitor provides a look at the server's overall health. The Health Monitor not only provides statistics related to server processes and hardware use such as CPU utilization, but it can be used to create notifications so that you know when a particular server health statistic reaches a particular threshold. You can also view the statistics provided by the Health Monitor in a graph. Figure 19.5 shows the graph for the server's CPU utilization. Figure 19.5. The Health Monitor provides graphs of server processes. When you monitor server hardware and server processes' performance, you are trying to identify bottlenecks. A bottleneck can be a hardware component on a server, such as the processor or the memory, that is being overtaxed and slowing down overall system performance. Once your server is configured and your network is up and running, it is important to use your server monitoring software to establish a baseline. A baseline is a set of initial readings when the network is fully operational and typically running well. This set of baseline readings can then be used for comparison when you take readings on server performance in the future. The different server monitoring tools in the different network environments will obviously all operate differently. In the NetWare environment, the Health Monitor can be used to track the CPU utilization and other processes. In the Windows network environment, hardware and service performance are tracked using Performance Monitor. To help illustrate some issues related to monitoring server processes, let's take a closer look at how the Performance Monitor works. Tip
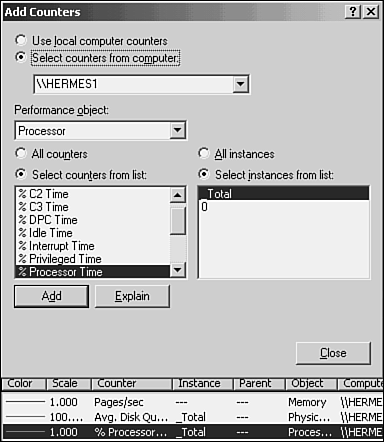
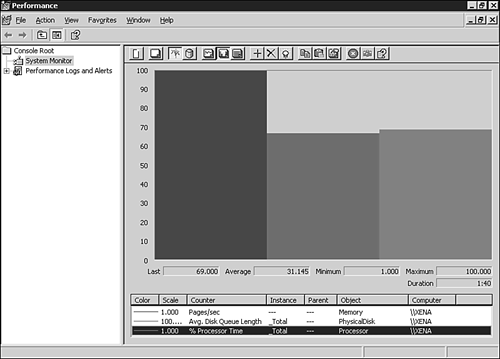
On a Windows server, any process that can be measured is referred to as an object , and performance objects are added to a graphing system as counters . For example, let's say you want to monitor the processor on a server running Windows Server 2003. Once you get the Performance Monitor tool open , you need to add a counter to the monitor for processor performance. The Windows Performance Monitor provides a dialog box that groups different counters into categories, such as Processor, Physical Disk, and Paging File (which is the virtual memory on your computer; too much access of the paging file shows that the computer could use a little more RAM). Figure 19.6 shows the Performance Monitor's Add Counters dialog box. Figure 19.6. Counters used to monitor server performance are easily added to the Windows Server 2003 Performance Monitor. Once a counter is added to the Performance Monitor, the performance of the particular object (such as processor time) can be viewed . Figure 19.7 shows the histogram chart for processor time on a Windows server. Figure 19.7. Processor use on the server can be monitored using the Performance Monitor. Once you set up your particular performance monitor with the appropriate counters, you can actually save the data as a log file. This provides you with a baseline you can use to compare with future performance data. Many of the Performance Monitor tools also allow you to create alerts. An alert actually "alerts" you when a predefined threshold has been reached on a particular counter. For example, you might want to create a performance alert that alerts you when a file server's drive (or drives) has reached a certain percent of total capacity. The Windows Performance Monitor actually sends the alert to the Windows Event Viewer's Application Log. Tip
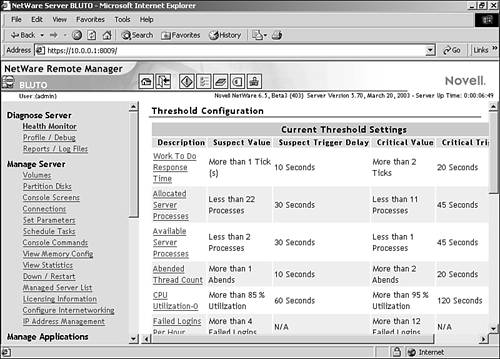
NetWare 6.5 also provides you with the ability to create alerts related to different server processes. Default thresholds are set for different server processes such as CPU utilization; you can change the threshold settings in the Remote Manager. Figure 19.8 shows the threshold settings for a NetWare server on the Remote Manager. Figure 19.8. Event alerts can be used to help you stay on top of server use issues and can be configured in most server environments. Regardless of the network operating system you use, it is important to set up some sort of system where you monitor server resources and then compare them against benchmarks that you have established. When monitoring server performance, try to build some consistency into your measurements by logging information at times of peak network use and by consistently measuring the same parameters so that you have data for comparison. |

EAN: 2147483647
Pages: 188