Section 8.5. Step 4: Determining Priorities
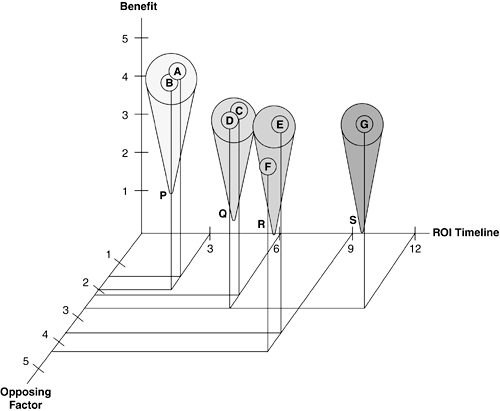
8.5. Step 4: Determining PrioritiesThe factors involved in building a business case can now be combined to determine its priority among the set of all business cases created for RFID adoption. To get a relative sense of how the different business cases of the selected application areas stand, you can pit these against themselves in different ways. Several multidimensional visualization tools you can use for this purpose are currently on the market, and some are in the public domain. A simple way to visualize the variables without using any such tools is to create a super "opposing" factor by combining the cost, risk, and complexity factors. One way to calculate such a variable is to take the simple average of these factors. For example, if benefit, cost, risk, and complexity factors are measured using a point scale of 1 to 5, as described previously, the "opposing" factor for a business case whose cost = 2.5, risk = 2, and complexity = 2 is (2.5 + 2 + 2)/3, or 2.17 (approximately). You can also calculate a suitable weighted average. Note that if the factors have extreme values (for example, cost = 4, risk = 1, complexity = 1), such a variable can skew the measures somewhat. The benefit, "opposing" factor, and ROI timeline can then be plotted in a three-dimensional coordinate system to visualize the different parameters. This generally clusters the business cases into distinct groups or vertical cones. Each such cone represents a certain priority and can also be called priority cones. The business cases inside a priority cone can again be ranked against each other to assert their relative priorities. It is suggested that business cases with relatively good benefit and shorter ROI timeline with acceptable cost, low complexity, and risk be given preference for implementation and thus the highest priority unless the business has good reasons otherwise. The priority cones for these business cases tend to be closest to the origin of the coordinates. Figure 8-12 shows an example set of business cases with benefit, cost, risk, complexity, and "opposing" factor (using a simple average of cost, risk, and complexity) all plotted on a scale of 1 to 5, and ROI timelines in months. Figure 8-13 shows the resulting priority cones for these use cases. The business cases inside the priority cone P should be assigned the highest priority and implemented first. Figure 8-12. An example comparison of the factors of a group of business cases. Figure 8-13. The priority cones corresponding to the previous business cases.
|
EAN: 2147483647
Pages: 100
- Understanding SQL Basics and Creating Database Files
- Using SQL Data Definition Language (DDL) to Create Data Tables and Other Database Objects
- Understanding SQL Subqueries
- Understanding Transaction Isolation Levels and Concurrent Processing
- Writing External Applications to Query and Manipulate Database Data
