Collecting and Analyzing Statistics
| Until Oracle 9i, you could have used the COMPUTE STATISTICS option of the ANALYZE command to get faster statistics, especially for newly created indexes, which is not recommended in Oracle Database 10g. The COMPUTE and ESTIMATE clauses of the ANALYZE statement are still supported in Oracle Database 10g for backward compatibility. You may use the ANALYZE command to collect information on free list blocks and to list chained rows. From Oracle 8i, you also have the option of using the DBMS_STATS package to generate more accurate statistics than the legacy ANALYZE command. The DBMS_STATS package gathers statistics on tables, indexes, individual columns, and table partitions. You can even gather statistics on clustered tables with Oracle Database 10g Release 2, but not using Release 1. You can also use DBMS_STATS.GATHER_DICTIONARY_STATS to gather statistics on system schemas. In Oracle Database 10g, you can use optimizer statistics, which give details about the database and the objects in the database. These statistics are stored in several data dictionary views. You can query the following data dictionary views (DBA_*, USER_*, or ALL_*) to get more details on database objects:
These optimizer statistics are automatically gathered with the GATHER_STATS_JOB job, created during database creation, on all objects in the database with missing statistics and stale statistics. This job is managed by the scheduler during the maintenance window. The default maintenance window runs from 10 p.m. to 6 a.m. every night and all day on weekends. The GATHER_STATS_JOB invokes the DBMS_STATS.GATHER_DATABASE_STATS_JOB_PROC procedure to collect statistics on database objects with no statistics or stale statistics. Until Oracle 9i, you could automatically invoke DBMS_STATS to gather statistics for a table by using the MONITORING keyword with CREATE TABLE or ALTER TABLE statement. In Oracle Database 10g, MONITORING and NOMONITORING have been deprecated and table monitoring is controlled by the STATISTICS_LEVEL parameter. Monitoring is enabled when the parameter is set to TYPICAL and disabled with BASIC.
You will look at this topic in greater detail in Chapter 14 "Influencing the Cost Based Optimizer," and learn how these statistics affect the working of the optimizer. Preventing the Time Out of GATHER_STATS_JOBOracle Database 10g has a default maintenance window, where the optimizer statistics are automatically collected. If all the statistics have not been collected by the end of the maintenance window, the jobs can be cancelled or allowed to run until completion of the process. This is controlled by the STOP_ON_WINDOW_CLOSE parameter of the GATHER_STATS_JOB. The default setting for this paraneter is TRUE, which terminates the job not completed at the end of the maintenance window. A trace file is generated with an ORA-01013 error with a list of all objects that couldn't finish gathering statistics within the maintenance window. You can manually control this job using the catmwin.sql ($ORACLE_HOME/rdbms/admin/catmwin.sql) and editing the entry for DBMS_SCHEDULER.SET_ATTRIBUTE('GATHER_STATS_JOB'). You can also disable the automatic statistics collection using the following command. EXECUTE DBMS_SCHEDULER.DISABLE('GATHER_STATS_JOB'); Cross-Checking Your Statistics and RatiosBefore you come to any conclusions by reviewing the performance data, you should cross-check it with other available evidence relating to the data. A classic example is the use of hit ratios like the buffer cache hit ratio and the latch hit ratio. These ratios should be used as indicators of database problems and not as final answers to solve your performance issues. You should look always for any other related evidence that causes deteriorating performance like increased number of users or running low on memory and so on. Also, when you are using computed statistics (rates or ratios), you should cross-check the computed statistic value with the actual statistic count. When you use wait events with TIMED_STATISTICS set to trUE at the instance level, you get data for comparing the total wait time for an event to the total elapsed time between the performance data collection periods. Look for how long the wait event occurred out of the total elapsed time and decide whether the wait time was a significant percentage of the total time. This methodology will help you to spend time on meaningful incidents rather than looking at all wait events. Also, the idle wait events are not useful and could be overlooked, because they indicate merely idle server processes. AWR Reports GenerationThe AWR has a reports-generation mechanism to produce summary reports based on database statistics stored in the AWR repository. This is very similar to STATSPACK in previous database versions. The analysis is done on statistics over a period of time. The reports are generated using the scripts (awrrpt.sql, awrrpti.sql, awrsqrpt.sql, and awrsqrpi.sql) in the $ORACLE_HOME/rdbms/admin directory. The database user should have DBA privileges to run these reports. All these reports can be generated as HTML pages or as text reports. The awrrpt.sql shows all the AWR snapshots available and prompts you for options on how and where the reports are generated. The awrrpti.sql script displays the statistics for a range of snapshot IDs on a specified database and instance. The awrddrpt.sql script shows statistics of a particular SQL statement for a range of snapshot IDs. This report will help you to debug the performance of a SQL statement. The awrddrpi.sql script shows the statistics of a SQL statement for a range of snapshot IDs on a specified database and instance. We have used Oracle Database 10g Release 2 for the following four subsections involving AWR reports. The names of these scripts could change in future releases of Oracle. Generating AWR Reports Using awrrpt.sqlThe script awrrpt.sql produces two types of output: text format (like STATSPACK report, but from AWR repository) and the default HTML format (with hyperlinks). When you run the script, you will be prompted for the report format (text or HTML) as well as the report name. Entering the number of days will give the most recent snapshots for those days until the time the report was run. The output filename is the user-specified name given for the report. In Listing 6.1 and in Figures 6.1 and 6.2, you will see how the awrrpt.sql is run and the report generated. If the report is created in HTML format, it can be viewed through any browser software. The code listing has been trimmed to conserve space. Listing 6.1. Running awrrpt.sqlOracle Database 10g Enterprise Edition Release 10.2.0.0.0 - 64bit With the Partitioning, OLAP and Data Mining options SQL> @awrrpt.sql Current Instance ~~~~~~~~~~~~~~~~ DB Id DB Name Inst Num Instance ----------- ------------ -------- ------------ 2931102824 Q0OR10G 1 Q0OR10G Specify the Report Type ~~~~~~~~~~~~~~~~~~~~~~~ Would you like an HTML report, or a plain text report? Enter 'html' for an HTML report, or 'text' for plain text Defaults to 'html' Type Specified: html Instances in this Workload Repository schema ~~~~~~~~~~~~~~~~~~~~~~~~~~~~~~~~~~~~~~~~~~~~ DB Id Inst Num DB Name Instance Host ------------ -------- ------------ ------------ ------------ * 2931102824 1 Q0OR10G Q0OR10G QLAB10G.US.ACME.COM Using 2931102824 for database Id Using 1 for instance number Specify the number of days of snapshots to choose from ~~~~~~~~~~~~~~~~~~~~~~~~~~~~~~~~~~~~~~~~~~~~~~~~~~~~~~ Entering the number of days (n) will result in the most recent (n) days of snapshots being listed. Pressing <return> without specifying a number lists all completed snapshots. Enter value for num_days: 3 Listing the last 3 days of Completed Snapshots Snap Instance DB Name Snap Id Snap Started Level ------------ ------------ --------- ------------------ ----- Q0OR10G Q0OR10G 8 21 Apr 2005 00:00 1 9 21 Apr 2005 01:00 1 10 21 Apr 2005 02:00 1 -------------------<Code Listing Truncated> ---------------- 29 21 Apr 2005 21:00 1 30 21 Apr 2005 22:00 1 -------------------<Code Listing Truncated> ---------------- 40 22 Apr 2005 08:00 1 41 22 Apr 2005 09:00 1 42 22 Apr 2005 10:00 1 43 22 Apr 2005 11:00 1 44 22 Apr 2005 12:00 1 45 22 Apr 2005 13:00 1 -------------------<Code Listing Truncated> ---------------- 68 23 Apr 2005 12:00 1 69 23 Apr 2005 13:00 1 Specify the Begin and End Snapshot Ids ~~~~~~~~~~~~~~~~~~~~~~~~~~~~~~~~~~~~~~ Enter value for begin_snap: 41 Begin Snapshot Id specified: 41 Enter value for end_snap: 44 End Snapshot Id specified: 44 Specify the Report Name ~~~~~~~~~~~~~~~~~~~~~~~ The default report file name is awrrpt_1_41_44.html. To use this name, press <return> to continue, otherwise enter an alternative. Enter value for report_name: awrrpt_1_41_44_Q0.html Using the report name awrrpt_1_41_44_Q0.html -------<Pages of html code, truncated for saving space> ------- <P> End of Report </BODY></HTML> Report written to awrrpt_1_41_44_Q0.html SQL> Figure 6.1. Summary page of the AWR report.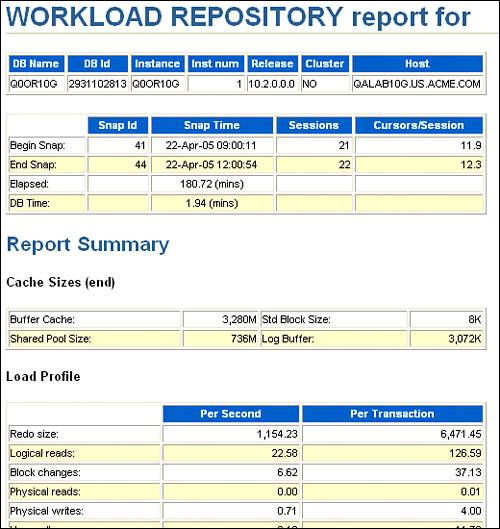 Figure 6.2. A sample list of statistics in an AWR report.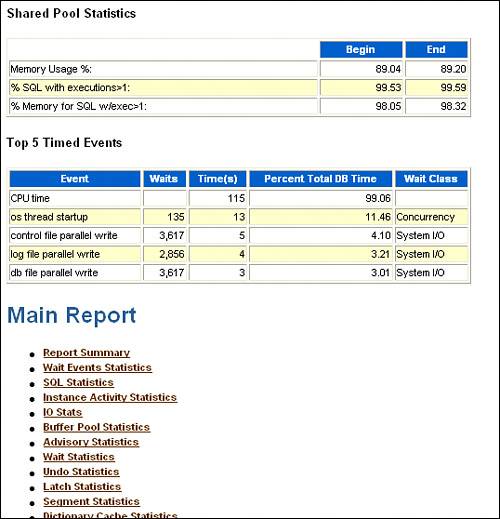 Listing 6.2 gives you the information on SNAP_ID and corresponding time spans for a 24-hour period. You can modify the query to include smaller or larger time frames and more details from the DBA_HIST_SNAPSHOT view. Listing 6.2. Selecting SNAP_IDs for a Time Period[View full width] SQL> select dbid, snap_id, begin_interval_time, end_interval_time from dba_hist_snapshot Generating AWR Reports Using awrrpti.sql
The awrrpti.sql script displays the statistics for a range of snapshot IDs on a specified database and instance, as shown in Listing 6.3 and in Figure 6.3. It produces two types of output: text format and the default HTML format (with hyperlinks). Listing 6.3. Using awrrpti.sqlSQL> @awrrpti.sql Specify the Report Type ~~~~~~~~~~~~~~~~~~~~~~~ Would you like an HTML report, or a plain text report? Enter 'html' for an HTML report, or 'text' for plain text Defaults to 'html' Enter value for report_type: html Type Specified: html Instances in this Workload Repository schema ~~~~~~~~~~~~~~~~~~~~~~~~~~~~~~~~~~~~~~~~~~~~ DB Id Inst Num DB Name Instance Host ------------ -------- ------------ ------------ ------------ * 2931102824 1 Q0OR10G Q0OR10G QLAB10G.US.ACME.COM Enter value for dbid: 2931102824 Using 2931102824 for database Id Enter value for inst_num: 1 Using 1 for instance number Specify the number of days of snapshots to choose from ~~~~~~~~~~~~~~~~~~~~~~~~~~~~~~~~~~~~~~~~~~~~~~~~~~~~~~ Entering the number of days (n) will result in the most recent (n) days of snapshots being listed. Pressing <return> without specifying a number lists all completed snapshots. Enter value for num_days: 2 Listing the last 2 days of Completed Snapshots Snap Instance DB Name Snap Id Snap Started Level ------------ ------------ --------- ------------------ ----- Q0OR10G Q0OR10G 128 26 Apr 2005 00:00 1 129 26 Apr 2005 01:00 1 -------------------<Code Listing Truncated> ---------------- 151 26 Apr 2005 23:00 1 152 27 Apr 2005 00:00 1 153 27 Apr 2005 01:00 1 154 27 Apr 2005 02:00 1 155 27 Apr 2005 03:00 1 156 27 Apr 2005 04:00 1 157 27 Apr 2005 05:00 1 158 27 Apr 2005 06:00 1 159 27 Apr 2005 07:00 1 160 27 Apr 2005 08:00 1 161 27 Apr 2005 09:00 1 -------------------<Code Listing Truncated> ---------------- 172 27 Apr 2005 20:00 1 Specify the Begin and End Snapshot Ids ~~~~~~~~~~~~~~~~~~~~~~~~~~~~~~~~~~~~~~ Enter value for begin_snap: 152 Begin Snapshot Id specified: 152 Enter value for end_snap: 160 End Snapshot Id specified: 160 Specify the Report Name ~~~~~~~~~~~~~~~~~~~~~~~ The default report file name is awrrpt_1_152_160.html. To use this name, press <return> to continue, otherwise enter an alternative. Enter value for report_name:awrrpt_1_152_160_Q0.html Using the report awrrpt_1_152_160_Q0.html ---- </BODY></HTML> Report written to awrrpt_1_152_160_Q0.html SQL> Figure 6.3. Summary page of the AWR Snapshot Statistics report.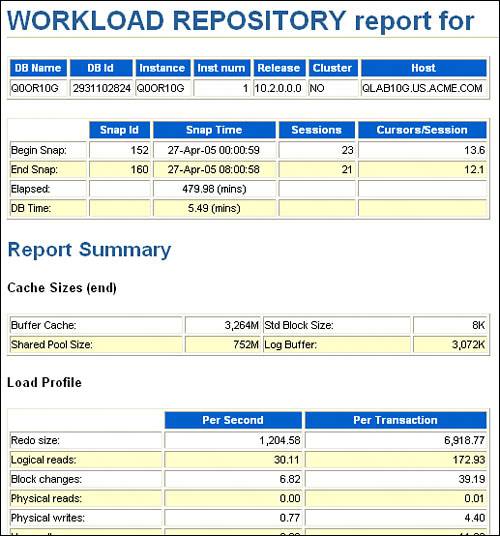 Generating AWR Reports Using awrddrpt.sqlThe awrddrpt.sql displays the statistics of a particular SQL statement for a range of snap-shot IDs. This report (in text format and in the default HTML format) will help you to debug the performance of a SQL statement. In Listing 6.4 and in Figure 6.4, you will see how the awrddrpt.sql is run and the report that is generated. Listing 6.4. Using awrddrpt.sqlSQL> @awrddrpt.sql Current Instance ~~~~~~~~~~~~~~~~ DB Id DB Id DB Name Inst Num Inst Num Instance ----------- ----------- ------------ -------- -------- ------------ 2931102824 2931102824 Q0OR10G 1 1 Q0OR10G Specify the Report Type ~~~~~~~~~~~~~~~~~~~~~~~ Would you like an HTML report, or a plain text report? Enter 'html' for an HTML report, or 'text' for plain text Defaults to 'html' Enter value for report_type: html Type Specified: html Instances in this Workload Repository schema ~~~~~~~~~~~~~~~~~~~~~~~~~~~~~~~~~~~~~~~~~~~~ DB Id Inst Num DB Name Instance Host ------------ -------- ------------ ------------ ------------ * 2931102824 1 Q0OR10G Q0OR10G QLAB10G.US.ACME.COM Database Id and Instance Number for the First Pair of Snapshots ~~~~~~~~~~~~~~~~~~~~~~~~~~~~~~~~~~~~~~~~~~~~~~~~~~~~~~~~~~~~~~~ Using 2931102824 for Database Id for the first pair of snapshots Using 1 for Instance Number for the first pair of snapshots Specify the number of days of snapshots to choose from ~~~~~~~~~~~~~~~~~~~~~~~~~~~~~~~~~~~~~~~~~~~~~~~~~~~~~~ Entering the number of days (n) will result in the most recent (n) days of snapshots being listed. Pressing <return> without specifying a number lists all completed snapshots. Enter value for num_days: 1 Listing the last day's Completed Snapshots Snap Instance DB Name Snap Id Snap Started Level ------------ ------------ --------- ------------------ ----- Q0OR10G Q0OR10G 152 27 Apr 2005 00:00 1 153 27 Apr 2005 01:00 1 -------------------<Code Listing Truncated> ---------------- 172 27 Apr 2005 20:00 1 Specify the First Pair of Begin and End Snapshot Ids ~~~~~~~~~~~~~~~~~~~~~~~~~~~~~~~~~~~~~~~~~~~~~~~~~~~~ Enter value for begin_snap: 168 First Begin Snapshot Id specified: 168 Enter value for end_snap: 170 First End Snapshot Id specified: 170 Instances in this Workload Repository schema ~~~~~~~~~~~~~~~~~~~~~~~~~~~~~~~~~~~~~~~~~~~~ DB Id Inst Num DB Name Instance Host ------------ -------- ------------ ------------ ------------ * 2931102824 1 Q0OR10G Q0OR10G QLAB10G.US.ACME.COM Database Id and Instance Number for the Second Pair of Snapshots ~~~~~~~~~~~~~~~~~~~~~~~~~~~~~~~~~~~~~~~~~~~~~~~~~~~~~~~~~~~~~~~ Using 2931102824 for Database Id for the second pair of snapshots Using 1 for Instance Number for the second pair of snapshots Specify the number of days of snapshots to choose from ~~~~~~~~~~~~~~~~~~~~~~~~~~~~~~~~~~~~~~~~~~~~~~~~~~~~~~ Entering the number of days (n) will result in the most recent (n) days of snapshots being listed. Pressing <return> without specifying a number lists all completed snapshots. Enter value for num_days2: 1 Listing the last day's Completed Snapshots Snap Instance DB Name Snap Id Snap Started Level ------------ ------------ --------- ------------------ ----- Q0OR10G Q0OR10G 152 27 Apr 2005 00:00 1 153 27 Apr 2005 01:00 1 -------------------<Code Listing Truncated> ---------------- 172 27 Apr 2005 20:00 1 Specify the Second Pair of Begin and End Snapshot Ids ~~~~~~~~~~~~~~~~~~~~~~~~~~~~~~~~~~~~~~~~~~~~~~~~~~~~~ Enter value for begin_snap2: 152 Second Begin Snapshot Id specified: 152 Enter value for end_snap2: 154 Second End Snapshot Id specified: 154 Specify the Report Name ~~~~~~~~~~~~~~~~~~~~~~~ The default report file name is awrdiff_1_168_1_152.html To use this name, press <return> to continue, otherwise enter an alternative. Enter value for report_name: press <return> to continue, otherwise enter an alternative. Enter value for report_name: awrdiff_1_168_1_152.html Using the report name awrdiff_1_168_1_152.html -------------------<Listing Truncated> ---------------- Report written to awrdiff_1_168_1_152.html SQL> Figure 6.4. AWR report: awrddrpt.sql.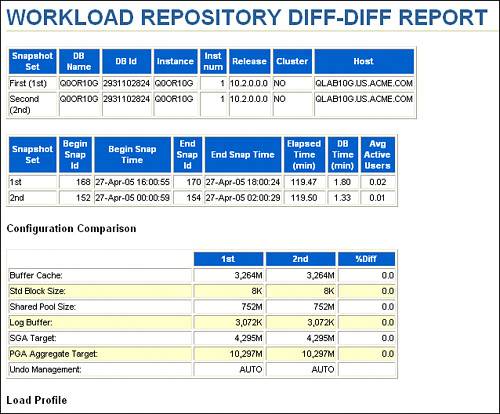 Generating AWR Reports Using awrddrpi.sqlThe awrsqrpi.sql script shows the statistics of SQL statement execution for a range of snapshot IDs on a specified database and instance. This report also comes in both text format and HTML format. Execution is similar to awrddrpt.sql; for this reason, only the differences in code execution are shown in Listing 6.5. See Figure 6.5 for the opening page of the report, but realize that the report spans several pages because the other AWR scripts are displayed here completely. You could choose different databases to compare the same script execution, instead of the same database as in Listing 6.5. Listing 6.5. Using awrddrpi.sqlSQL> @awrddrpi.sql -------------------<Listing Truncated> ---------------- Instances in this Workload Repository schema ~~~~~~~~~~~~~~~~~~~~~~~~~~~~~~~~~~~~~~~~~~~~ DB Id Inst Num DB Name Instance Host ------------ -------- ------------ ------------ ------------ * 2931102824 1 Q0OR10G Q0OR10G QLAB10G.US.ACME.COM Database Id and Instance Number for the First Pair of Snapshots ~~~~~~~~~~~~~~~~~~~~~~~~~~~~~~~~~~~~~~~~~~~~~~~~~~~~~~~~~~~~~~~ Enter value for dbid: 2931102824 Using 2931102824 for Database Id for the first pair of snapshots Enter value for inst_num: 1 Using 1 for Instance Number for the first pair of snapshots Specify the number of days of snapshots to choose from -------------------<Listing Truncated> ---------------- Specify the First Pair of Begin and End Snapshot Ids ~~~~~~~~~~~~~~~~~~~~~~~~~~~~~~~~~~~~~~~~~~~~~~~~~~~~ Enter value for begin_snap: 162 First Begin Snapshot Id specified: 162 Enter value for end_snap: 164 First End Snapshot Id specified: 164 Instances in this Workload Repository schema ~~~~~~~~~~~~~~~~~~~~~~~~~~~~~~~~~~~~~~~~~~~~ DB Id Inst Num DB Name Instance Host ------------ -------- ------------ ------------ ------------ * 2931102824 1 Q0OR10G Q0OR10G QLAB10G.US.ACME.COM Database Id and Instance Number for the Second Pair of Snapshots ~~~~~~~~~~~~~~~~~~~~~~~~~~~~~~~~~~~~~~~~~~~~~~~~~~~~~~~~~~~~~~~ Enter value for dbid2: 2931102824 Using 2931102824 for Database Id for the second pair of snapshots Enter value for inst_num2: 1 Using 1 for Instance Number for the second pair of snapshots Specify the number of days of snapshots to choose from -------------------<Listing Truncated> ---------------- Enter value for num_days2: 1 Listing the last day's Completed Snapshots Snap Instance DB Name Snap Id Snap Started Level ------------ ------------ --------- ------------------ ----- Q0OR10G Q0OR10G 152 27 Apr 2005 00:00 1 -------------------<Listing Truncated> ---------------- 172 27 Apr 2005 20:00 1 Specify the Second Pair of Begin and End Snapshot Ids Enter value for begin_snap2: 170 Second Begin Snapshot Id specified: 170 Enter value for end_snap2: 172 Specify the Report Name ~~~~~~~~~~~~~~~~~~~~~~~ -------------------<Listing Truncated> ---------------- Enter value for report_name: awrdiff_1_162_1_170.html Report written to awrdiff_1_162_1_170.html SQL> Figure 6.5. AWR report: awrddrpi.sql.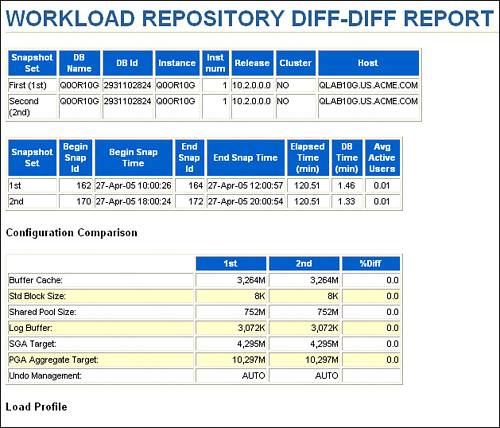 |
EAN: 2147483647
Pages: 214