Practice 4. Measure Progress Objectively
| Bruce MacIsaac Objective measurement of progress helps you to manage cost, schedule, people, and priorities. ProblemA software project's progress is difficult to measure objectively due to a number of challenges:
This practice describes some approaches to ensure that progress is measured objectively and is therefore providing useful data for project management. BackgroundWe explain why progress measures are important, their limitations, and their connection to estimation. Why Measuring Progress Is Important
If you don't objectively know how your project is progressing, you don't really know if it's failing or succeeding. A senior vice president at a company I once worked for remarked that the biggest problem the company faced was not that projects failed, but that they failed after the money had been spent. He wanted to identify failing projects while there were still options, such as renegotiating scope, bringing in outside help, or canceling before it was too late. This is where effective progress measures are vital, because they enable management to address key questions, such as the following:
Progress measures can also serve as an indicator of project health. Poor progress often indicates overall problems that need to be addressed, such as people issues (for example, lack of skills or low morale), and process issues (for example, too much bureaucracy or lack of clear direction). As you address these problems, you can use progress measures to evaluate your success. Estimation and Progress Measurement Are ConnectedEstimates are directly tied to progress measurement: saying you are 10 percent done means that you estimate that 90 percent of the work remains to be done. Software estimating is difficult, and even the best estimation techniques can yield poor results. Estimates are typically done early in the project, before the problems are well understood, and yet they are then carved in stone. Team members often try to live up to those estimates, even after it becomes clear that they are unachievable.[26] Progress measurement alleviates these problems by allowing original estimates, however poor, to be refined as the project proceeds.
Understand the Limitations of the Measures That You Are ApplyingThere is an Indian legend about six blind men who each went to see an elephant. The one who felt the trunk concluded that elephants are snakelike, the one who felt the tusk concluded that the elephant was spearlike, and so on. Unfortunately, most measures are prone to similar misinterpretations, because they similarly focus on a small part of the overall picture. The following are some experiences I've had with measures misuse.
Once I refactored some badly written code and reduced it to one-fifth its original size. Our team measured productivity by the source lines of code delivered weekly, so by this measure it appeared that I had made "negative" progress. Understandably, I was worried how my "negative" productivity would appear. Similar issues come up when code is reused, rather than created from scratch. On another project with multiple teams, one team logged only serious defects that would take several days to fix; smaller defects were fixed immediately or were grouped into a few Change Requests. Another team logged every tiny problem. The conclusion? Obviously the first team had higher-quality code, since they had fewer defects! An equally wrong conclusion is that the second team was more productive because it had a higher defect-fixing rate! The lesson is to understand the limits of the measures that you are applying and to account for these limitations when drawing conclusions. Applying the PracticeSeveral methods can be used to measure progress objectively; we'll describe some basic principles and their limitations. We discuss the following:
Measure Progress by End-User Capabilities and MaterialsThe goal of a software project is to deliver a usable software product. So the most objective progress measure is working code that delivers functionality, plus documentation and training materials for using that functionality. Unfortunately, typical waterfall development projects will happily claim progress based on completion of parts of the development, rather than on working functionality, for example:
In an iterative approach, the software grows in stagesiterationswith an executing build producing functional software at the end of each iteration. This approach requires some work in each of the disciplines: requirements, analysis and design, implementation, testing, project management, and so on. The key differentiating factor from waterfall development is that because iterative development includes all the work required to deliver working functionality, it allows for more reliable estimation of future work.
The key to measuring progress is breaking down the requirements into increments that can be delivered in each iteration. Requirements are assigned to iterations based on priority, as described in Practice 10: Prioritize Requirements for Implementation. The estimated effort includes design, implementation, and test effort and is used to determine how much can be accomplished in the iteration. So what is the actual measure of progress? The simplest measure is the percentage of work accomplishedadd up estimates for completed scenarios and divide these by the estimates for scenarios planned to complete in the iteration. Measuring progress based on the percentage of estimated work completed, and not counting partial progress on tasks, is called "earned value."[27] However, traditional earned-value approaches allow credit to be taken for completion of any task. A more conservative approach is to give credit only for usable capabilities and materials, that is, integrated and tested scenarios plus end-user documentation and training materials.
Extrapolate "Like" ActivitiesxOne of the main reasons we measure progress is to adjust our estimates of future tasks. When reestimating work, it is important to make the adjustments based on experience with similar tasks. The simplest way to do this is to adjust estimates at the start of each iteration by the percentage of estimated work completed for the previous iteration. For example, if you completed only 90 percent of planned work in the previous iteration, you should increase your estimates for the next iteration accordingly (dividing your remaining estimates by 90 percent). This usually works well, because the experience of the prior iteration is usually the best predictor of the next.[28]
Consider other factors: Will future tasks be performed by similarly skilled staff under similar conditions? Have the data been contaminated by "outliers," tasks that were severely overestimated or underestimated? Is effort being reported consistently (for example, is unpaid overtime included)? Was there a "learning curve" that has since been overcome? Visualize Progress
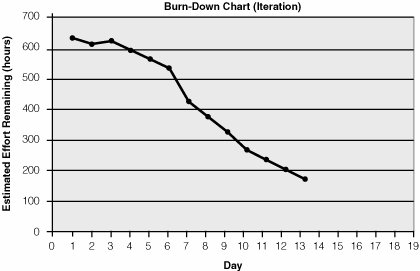
It is often useful to visualize progress. One of the best ways to do this is with a "burn-down" chart,[29] which shows the total remaining work on the y axis and time on the x axis. The goal is to get to zero remaining effort. Burn-down charts can be used within an iteration to visualize progress of work assigned to the iteration (see Figure 2.7).
Figure 2.7. Example of a Burn-Down Chart (Iteration).Burn-down charts can be used to visualize progress during an iteration. Burn-down charts can also be used to visualize progress of the project as a whole[30] (see Figure 2.8).
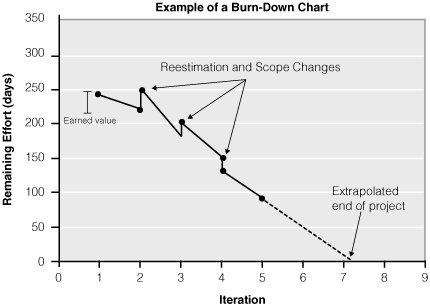
Figure 2.8. Example of a Burn-Down Chart (Project).A burn-down chart for a project can be used to visualize progress on the project as a whole and thus help predict when project work will be completed. It can be helpful to show the following points on a project or release burn-down chart:
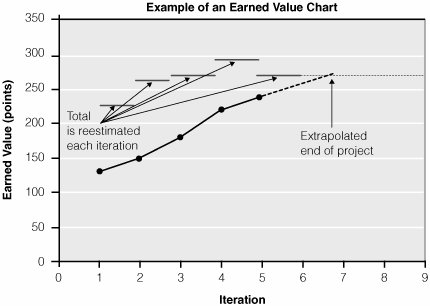
The difference gives the "earned value" (see Figure 2.8), and the line can be extrapolated to estimate project completion. The spikes at the end of each iteration show the result of scope changes and reestimation on the remaining work. You can also add a third point to separate reestimated work from scope changes. A variation is to use "points" on the yaxis that reflect the relative effort of scenarios. At the end of each iteration, you add up the "points" for completed scenarios and reestimate the remaining work. Using points is more complicated, but it lets you see changes in productivity: a steeper chart indicates points being delivered at a faster rate.[31] Using points also lets you flip the chart around and show increasing progress as points are delivered. This kind of "earned value" chart is sometimes referred to as a "burn-up" chart.[32]
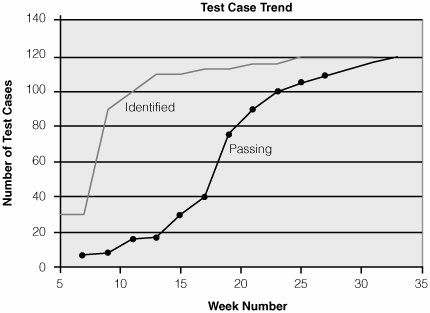
Figure 2.9. Example of an Earned-Value Chart.Charts of increasing earned value are an alternative way to visualize progress. Test Progress TrendIf the test function is integrated within the team, and there is thorough testing in each iteration, then "burn-down" or "burn-up" charts can incorporate test progress. However, many organizations have an independent test organization to supplement the testing done by the development team. Test managers can use burn-down or burn-up charts to measure test progress, but in this case, the "delivered" value to be measured is executing tests and passed tests. Less accurate, but simpler, is a count of passing acceptance tests (see Figure 2.10). Figure 2.10. Example of a Test Progress Trend Chart.From this chart you can see that no new test cases are being added, and progress suggests that in six weeks all test cases will pass, assuming progress remains linear.
Test progress trends are a simple measure of test progress, but they only represent part of the picture. They don't show how much time is spent on different kinds of testing, such as exploratory and performance testing, nor what kinds of testing are most effective. They don't indicate the quality of the build, nor the extent to which tests are blocked because of factors outside the tester's control. There are a number of techniques for measuring test effectiveness, such as using code coverage, tracking how much effort goes into discovering defects, and noting when discovery of new defects starts to trail off.[33] However, while additional metrics can help, qualitative assessments by the team are key to providing a balanced picture of test progress and test effectiveness. Assessing test effectiveness at the end of each iteration helps to improve test effectiveness in subsequent iterations.
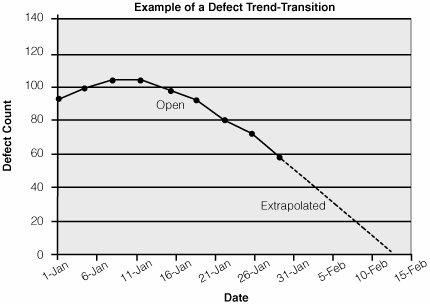
Measure Defect-Fixing ProgressDefect-fixing progress will occur in all iterations but becomes a key progress measure toward the end game, as the focus changes from completing code to ensuring good enough quality. But how can you apply earned value to defect fixing when you don't know how many defects there are, nor how long they will take to fix? Start by fixing defects iteratively. That is, as functionality is delivered, also test it thoroughly and fix the defects before declaring victory. Actual effort spent on identifying and correcting defects in one iteration can be applied to future iteration estimates. Practically speaking, however, most projects will defer some proportion of defects to future iterations. A growing defect backlog provides early warning that not enough effort has been allocated to defect fixing. The defect backlog is best illustrated by a trend chart.
Figure 2.11 shows a sample defect trend toward the end of a project. The trend can be used to predict when the product is expected to be good enough. Figure 2.11. Example of a Defect Trend in Transition Phase.From this chart we can project that on February 10 about 10 percent of defects will remain. One issue with this approach is that change requests will have different weights: one defect may affect a single line of code, whereas another will require major redesign. This problem can be addressed by weighing defects with an "estimated effort to fix," which allows defects to be incorporated into a standard burn-down or earned-value chart, either separate from or together with the overall project progress chart. Note Defects should be triaged based on how severely they will affect the customer. The sum of estimated effort for all outstanding "must fix" defects is a good measure of remaining work. A lack of recorded defects may imply a lack of testing. Be aware of the actual level of test effort when examining defect trends. Don't Measure Overall Progress in the Inception PhaseThe main goal of the Inception phase is to establish the business case for the project by, among other things, establishing an overall vision and rough estimates of cost and duration. Only when the project moves into the Elaboration phase does the focus shift to producing code and detailing requirements. A common question is how to measure progress during Inception, when there is no delivered functionality. The simple answer is, don't measure overall project progress during Inception. Instead, track your progress toward reaching the goals of Inception. These will generally be qualitative measures that assess whether you have identified the stakeholders; outlined needs, features, and risks; and estimated cost and schedule. This process helps you estimate when you can expect to complete the Inception phase, but it does not help you to extrapolate the progress of the project as a whole. The value of the Inception phase from a project management perspective is that it establishes the overall scope of the project, enabling sponsors to decide whether or not the project should proceed. Project estimates at this point are usually based on comparison with similar projects. As much as we might like to extrapolate from the effort and duration of Inception tasks to firm overall project estimates, there is little correlation between Inception work and the remaining phases of the project.
Other MethodsTraditional project management methods use earned value, along with related measures like "budgeted cost of work performed" to measure project progress. Traditional earned-value approaches allow credit to be taken for completion of any task. In a waterfall development approach this helps to show if the project is tracking according to estimates. However, until working software starts to be delivered, the project hasn't really provided any value, and this "progress" is therefore questionable. Unified Process, XP, and other agile methods value working code as the primary measure of progress, and developers are encouraged to use their experience in each iteration to estimate what can be achieved in the next. Variants of earned value are common. For example, XP has moved from recommending a relative "points-based" approach[34] to using absolute effort estimates.[35] Completed user stories provide a basic earned-value measure of progress, whether the estimates are points or absolute effort estimates. Unified Process, which uses completed use-case scenarios as the fundamental measure of progress, is similar in this respect.
Scrum[36] recommends burn-down charts for each iteration or "sprint" to track progress during the iteration, as well as a Product Backlog burn-down report at the end of each sprint to report on overall project progress. This is compatible with Unified Process. Both Unified Process and Scrum recommend that progress be measured at the end of each iteration and used to revise project estimates. Scrum burn-down charts are good tools for this. Note that since Unified Process is a method framework, it also allows for additional measures.
Levels of AdoptionThis practice can be adopted at three different levels:
Related Practices
Additional InformationInformation in the Unified ProcessOpenUP/Basic proposes the basic measures suited to most small projects. The key measures outlined here are proposed for inclusion in OpenUP/Basic. RUP adds descriptions of a large number of candidate measures for measuring the process and the product, along with guidance on when and how to apply those measures. In more formal projects, the RUP project manager selects from candidate measures and documents these selections in a measurement plan. Additional ReadingBurn-down charts, burn-up charts, and project velocity:
Traditional earned value approaches:
For additional measures to consider:
|
EAN: 2147483647
Pages: 98