| The NetWare POA has a user interface and thus can be monitored from the NetWare server's system console. By default, both the Linux and the Windows POAs are designed not to load with a user interface. Primarily this is done to save CPU cycles so that the server does not need to maintain the refreshes and so on of a graphical user interface. If, however, you would like to see the user interface of the GroupWise POA, you may. To do so on the Windows platform, just do not load the POA as a Windows service. To do so on the Linux platform, load the GroupWise POA with a -show switch passed from a command line. For example: /opt/novell/groupwise/agents/bin/gwpoa show @../share/po1.poa
This section talks of the GroupWise POA user interface from the perspective of a NetWare POA. The same features are roughly available in both the Linux and the Windows POA, but only if these POAs are loaded with a user interface. Like many Linux programs, the script that loads the Linux POA supports the following command-line switches, after it has been loaded: /etc/rc.d/grpwise start /etc/rc.d/grpwise stop /etc/rc.d/grpwise restart /etc/rc.d/grpwise status
After the GroupWise POA on NetWare has successfully loaded, the screen shown in Figure 8.4 will be available from the server console or from a remote console session. Figure 8.4. The POA console on a NetWare 6.5 server 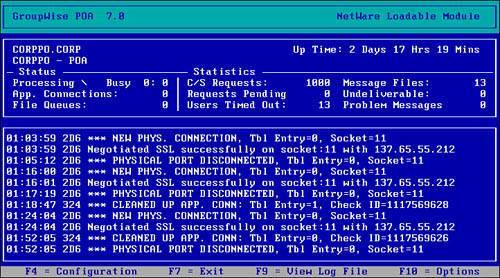
Tip Remember, to load the POA on NetWare, type LOAD GWPOA @STARTUPFILENAME.POA. (By default, the startup filename is the name of the post office.)
You can control the NetWare POA, to some extent, with keyboard commands you issue. The commands available from the main screen are the following: F4: Configuration F7: Exit F9: View Log File F10: Options
The F7 and F9 keystrokes need little explanation. Pressing the F7 key unloads the POA. If client/server connections are active, or if the QuickFinder indexing process is running, you will be prompted to confirm your decision to exit. Pressing the F9 key allows you to browse through the currently active log file. The Configuration Options Menu When you press the F4 key, the menu shown in Figure 8.5 appears. Figure 8.5. The POA Configuration Options menu 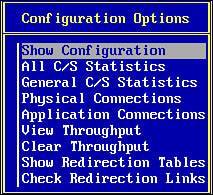
Each of the menu items here pumps information into the active log file when executed: Show Configuration: This option lists the configuration values and settings currently in memory. The settings you learned about in the section "Configuring the POA" are listed here. This list is identical in nature to the list of settings that the POA displays when it is first loaded. This list is not displayed in its own static window; rather it is dumped into the current active log of the POA. To review the configuration, press F9 to view the log file. All C/S Statistics: As the name suggests, this option dumps a list of all the client/server statistics into the current log file. Each of the options that follow in the rest of this bulleted list is a subset of this option, and those individual statistics are covered in their respective sections. General C/S Statistics: This option creates a section in the log file titled TCP Configuration. Beneath this section, you will find values for the configured limits of application and physical connections (Max), as well as the current number of active connections (Cur) and the highest the current value has reached (High). Physical Connections: This option lists the IP address and GroupWise user ID for each user who has a physical connection to the POA. A physical connection is a memory address for the transmission and receipt of TCP packets and will correspond to a port number. The port number used by the client and the POA for each connection is unfortunately not displayed. The numbers range from 1024 to 2048 or higher, depending on the number of users currently logged in. Application Connections: This lists the IP address and GroupWise user ID for each user who has an application connection to the POA. Most users will have more than one application connection, because these connections represent the windows or applications within the GroupWise client that are sharing the user's current physical connection. For example, a user with only the Inbox window open can have only one or two application connections. A user reading a mail message, running Notify, and browsing a shared folder will have at least three, and perhaps as many as six, application connections. View Throughput: This displays the client/server TCP/IP throughput for the POA. It does not include message transfer throughput or files processed from the WPCSOUT queues. Clear Throughput: Use this option to clear the throughput count. When view throughput is executed, the throughput calculations will be based on the last time the throughput was cleared, or the last time the agent was loaded. Show Redirection Tables: This option shows each of the POAs on the system, and their configured IP addresses and ports. The redirection table is used by the POA to connect users to other post offices for proxy purposes, for connections to libraries, or for redirected logins. The list shown here is from the perspective of this post office. Discrepancies between addresses shown on this list and addresses configured from ConsoleOne indicate a synchronization problem. Check Redirection Links: This option is the same as the Show Redirection Tables option, except that after each entry is listed, the POA attempts to connect to the POA at that address and shows the results of that attempt. This tool is especially valuablewith one keystroke, you can determine which POAs on your system are responding and which are not.
You will use these options and statistics on rare occasions, generally when troubleshooting communication problems. The Options Menu Pressing the F10 key pulls up the menu shown in Figure 8.6. Figure 8.6. The POA Options menu 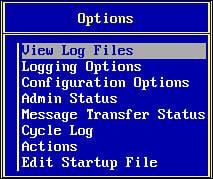
When troubleshooting the POA, you will use the Options menu rather often. Settings include the following: View Log Files: This option is similar to the main screen's F9 keystroke, but it offers more options. It brings up a list from which you can choose to browse not only the current log file (marked with an asterisk) but also any of the POA logs that reside on-disk. Logging Options: This option brings up the screen shown in Figure 8.7. Figure 8.7. The POA Logging Options menu 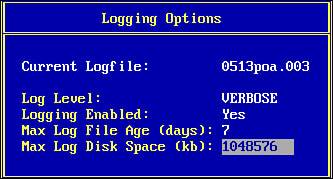
Use the up- and down-arrow keys to navigate and the Enter key to edit the selected logging option. The Esc key takes you back to the main screen.
Tip It is better to configure the POA logging from ConsoleOne. This way, the POA always starts with the settings you have selected. Reserve making changes from the POA's console screen for temporary situations and when troubleshooting. When you make changes from the POA's console screen, those changes aren't retained after the POA has been unloaded and reloaded. The option for diagnostic logging is not available from ConsoleOne. Generally you do not want your POA to perform diagnostic logging except for short periods of time. If by chance, though, you do want your POA to start with diagnostic logging, just add the /debug startup switch to the startup file of the POA.
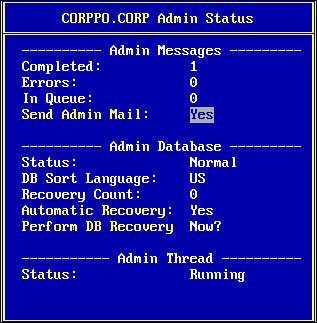
There are four available actions or configuration options in this dialog box. Again, use the up- and down-arrow keys to navigate, and press Enter to edit. These two options are especially useful: Perform DB Recovery: This executes an immediate recovery of WPHOST.DB. A recover is a structural database rebuild of the WPHOST.DB file. Status: This allows you to suspend processing of administration tasks (very useful if you are currently rebuilding this database offline and want to keep things in sync). Pressing the Esc key takes you back to the Options menu.
Message Transfer Status: This menu item calls up the Message Transfer Status screen. Following are the fields you will see in the Message Transfer Status screen: Outbound TCP/IP: This displays the IP address and message transfer port (MTP Port) of the domain's MTA that the POA talks to in order to transfer messages out of the post office. Inbound TCP/IP: This reflects the IP address and port that the MTA is expecting the POA to be listening on for incoming traffic to the post office. Hold: This is the directory where this POA queues up messages if the connection to the MTA is blocked for some reason. Last Closure Reason: This shows why the POA cannot connect to the MTA. It might not tell you exactly what's wrong, but it can give you a good idea of where the problem is. As with the Admin Status dialog box, pressing the Esc key takes you back to the Options menu.
Cycle Log: Cycling the log dumps the current log into a file and begins a new log file. This is useful when you are getting ready to use the Configuration Options menu to list some TCP information, and you want it to be at the top of the log file for easy access later. Actions: T his option calls up the Actions menu shown in Figure 8.9. Figure 8.9. The POA Actions menu 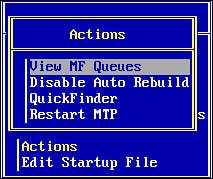
You are less likely to use the POA Actions menu; however, the actions available to you are great to have when you really need them. Settings include the following: View MF Queues: This allows you to see, at a glance, how many files are waiting in the WPCSOUT directory structure. These files are waiting for processing by the POA. The list is dumped into the current log file. Disable Auto Rebuild: This tells the POA not to attempt to rebuild damaged databases that it encounters in the course of message delivery or client/server processing. QuickFinder: This calls up the four-option dialog box shown in Figure 8.10. Figure 8.10. The POA QuickFinder menu 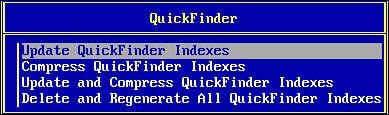
Update QuickFinder Indexes: This option launches the indexing process. All indexes served by this POA, including the mailbox index and all library indexes, will be updated. Compress QuickFinder Indexes: This merges all incremental indexes with the permanent index. The permanent index files will be renamed to reflect the time the operation was performed. Update and Compress QuickFinder Indexes: This performs both of the preceding operations, beginning with the update. Delete and Regenerate All QuickFinder Indexes: This deletes all the *.INC and *.IDX files in the post office\ofuser\index directory, and launches the indexing process to reindex all databases in the post office.
Warning Kick off the Delete and Regenerate All QuickFinder Indexes option only when the POA has a lot of time to spare; for example, on a Friday night. Depending on the amount of data you have, it can take more than a day to reindex all of your data.
There's really not much more you could want on the POA console screen to make it easy to troubleshoot. The POA console screen, particularly on the NetWare platform, is a big help. Undocumented POA Commands and Switches There are a few things you can make the POA do that are not listed in the menu items. These commands are typically used by Novell's technical support personnel to resolve sticky problems, or for troubleshooting. There are other undocumented POA commands; however, the two listed here are the ones you are most likely to need for troubleshooting. Let's take a look at these undocumented POA commands and switches: Ctrl+Z (diagnostic logging keystroke): This keystroke toggles diagnostic logging on and off. Diagnostic log files are much larger than verbose log files, but can contain information that is critical to correctly diagnosing a problem (hence the name). Running the POA in diagnostic mode for extended periods is not recommended. Performance degrades slightly in this mode. /IPLL-DIAG startup switch: This switch launches the POA with very detailed IP transaction logging, useful in conjunction with sniffer traces to isolate network problems.
Tip The GroupWise POA has several other startup switches. Use the /? switch to view a listing of other common switches that the POA supports. On the Linux platform use the -help switch.
|