Chapter 29: Creating the Sales Data Analyst Tool
|
Chapter 28, "Project Case Study—Creating the Sales Data Analyst Application," presented the case study of SellingOnTheWeb. It became clear from the case study that the development of the Sales Data Analyst tool will enable better utilization of sales data. The new tool will use the tags provided in ColdFusion MX to display sales data in charts and enable e-mail integration. The <cfchart> and <cfchartseries> tags enable chart display, and the <cfmail> and <cfpop> tags enable you to provide the e-mail functionality.
Designing Web Pages for the Sales Data Analyst Tool
You need to create all the CFML files using Dreamweaver MX and store them in the ProjectSeven directory created under the wwwroot directory on the Web server.
To give a consistent look to all the Web pages, you need to use a CSS named Project7.css. You need to use the class attributes of the various HTML tags to apply a specific style to a page.
Designing the Category Wise Sales Figures Page
Category Wise Sales Figures is the start page of the Sales Data Analyst tool. On this page, the user is able to view the total sales made in the current month and the entire year. You need to load two charts on this page. One of the charts shows the total sales of the month and year, and the other shows the items with the highest sales figures in the same period. The page also has a link to e-mails from customers.
To create charts, use the <cfchart> tags. To display data in the charts, use the <cfchartseries> tag. List the properties to be assigned to different charts on this page. The design of this page is shown in Figure 29.1.
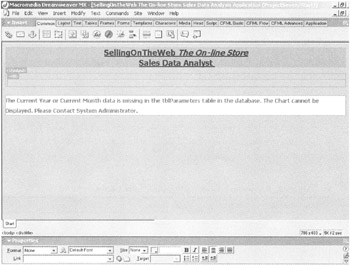
Figure 29.1: The design of the Category Wise Sales Figures page.
The Category Wise Sales Figures page contains the following controls:
-
Two HTML Table controls to display charts.
-
Two Chart controls to display sales data.
Set the properties of the first Chart control as listed in Table 29.1.
| Control | Property | Value |
|---|---|---|
| Chart | xAxisTitle | Category |
| Chart | yAxisTitle | Sales (in dollars) |
| Chart | format | jpg |
| Chart | Chartwidth | 350 |
| Chart | Chartheight | 300 |
| Chart | Show3d | No |
| Chart | tipStyle | mouseover |
| Chart | BackGroundColor | 99CC33 |
| Chart | Url | ViewItemForCategory.cfm |
This chart contains two series, one showing the monthly sales figures and the other showing the annual sales figures. Set the properties of the Chart series, as listed in Table 29.2.
| Chart Series | Property | Value |
|---|---|---|
| Series 1 | Type | bar |
| Series 1 | query | Category Wise Sales |
| Series 1 | valueColumn | CategorySales |
| Series 1 | itemColumn | Category |
| Series 1 | seriesLabel | Current year's sales |
| Series 2 | Type | bar |
| Series 2 | query | category wise |
| Series 2 | valueColumn | Category Sales |
| Series 2 | itemColumn | Category |
| Series 2 | seriesLabel | Current Sales |
| Series 2 | series color | blue |
The second chart shows the sales data for the items with highest sales figures. Set the properties of the second Chart control as listed in Table 29.3.
| Control | Property | Value |
|---|---|---|
| Chart | xAxisTitle | ItemDescription |
| Chart | yAxisTitle | sales(in dollars) |
| Chart | format | jpg |
| Chart | Chartwidth | 350 |
| Chart | Chartheight | 300 |
| Chart | Show3d | no |
| Chart | tipStyle | mouseover |
| Chart | BackGroundColor | 99CC33 |
| Chart | seriesPlacement | cluster |
Set the properties of the Chart series as listed in Table 29.4.
| Control | Property | Value |
|---|---|---|
| Series | type | pie |
| Series | query | TopTenItemsForThe month |
| Series | ValueColumn | CategorySales |
| Series | itemColumn | Category |
| Series | seriesLabel | Current year's sales |
Designing the Item Wise Sales Figures Page
The user can view the sales figures for the items sold for the selected category in a bar chart on the Item Wise Sales Figures page. The design of the Item Wise Sales Figures page is shown in Figure 29.2.
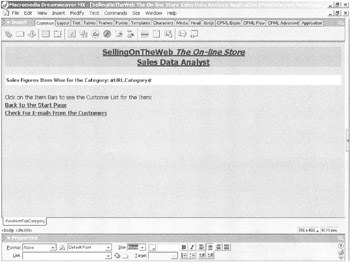
Figure 29.2: The design of the Item Wise Sales Figures page.
The Item Wise Sales Figures page contains one Chart control to display item-wise sales. This page also contains links to the start page and also to the e-mails from customers.
Set the properties of the Chart control as listed in Table 29.5.
| Control | Property | Value |
|---|---|---|
| Chart | xAxisTitle | ItemDesc |
| Chart | yAxisTitle | Sales (in dollars) |
| Chart | format | jpg |
| Chart | Chartwidth | 700 |
| Chart | Chartheight | 300 |
| Chart | Show3d | no |
| Chart | tipStyle | mouseover |
| Chart | BackGroundColor | FFFF99 |
| Chart | Url | ViewListOfCustomers.cfm |
| Chart | showborder | yes |
| Chart | rotated | yes |
Set the properties assigned to the Chart series as listed in Table 29.6.
| Chart Series | Property | Value |
|---|---|---|
| Series | type | bar |
| Series | query | ItemForTheCategory |
| Series | ValueColumn | ItemSales |
| Series | itemColumn | ItemDesc |
Designing the View Customer List Page
The View Customer List page displays the list of customers for the selected item and information about each customer, including name, age, gender, city, and state. The View Customer List page enables users to send offers and undertake e-campaigns by sending e-mails to customers. This page has links that take you back to the start page and a link to e-mails from the customers, as shown in Figure 29.3.
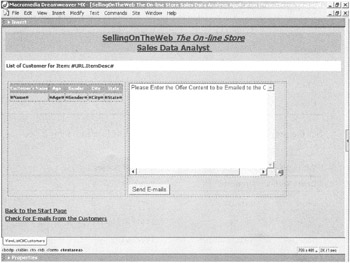
Figure 29.3: The design of the View Customer List page.
The View Customer List page contains the following controls:
-
A Form control that acts as a container for the Text Area and Button controls.
-
A Text Area control that accepts the content of the e-mail to be sent to customers.
-
A Button control that sends e-mails.
-
A Hidden control that saves the name of the item selected.
-
An HTML Table control that stores the dynamic data and text area.
Table 29.7 lists the properties of the Form control.
| Control | Property | Value |
|---|---|---|
| Form | Name | e-mails |
| Form | Action | Sendmails.cfm |
| Form | Method | POST |
The properties assigned to the Text Area control are listed in Table 29.8.
| Control | Property | Value |
|---|---|---|
| Text Area | name | content |
| Text Area | cols | 50 |
| Text Area | rows | 12 |
| Text Area | wrap | soft |
Set the properties of the Button control as listed in Table 29.9.
| Control | Property | Value |
|---|---|---|
| Button | Name | sendmail |
| Button | Type | Submit |
| Button | Value | Send E-mails |
Set the properties of the Hidden control as shown in Table 29.10.
| Control | Property | Value |
|---|---|---|
| Hidden | Name | ItemDesc |
| Hidden | Type | hidden |
| Hidden | Value | #URL.ItemDesc# |
Designing the View Customer E-Mail Page
You need to read the e-mails sent by customers from the POP server. The View Customer E-Mail page displays these e-mails. The server generates the content of this page dynamically. The e-mails are read into a query, and the content is displayed on the page. Figure 29.4 displays the design of the View Customer E-Mail page.
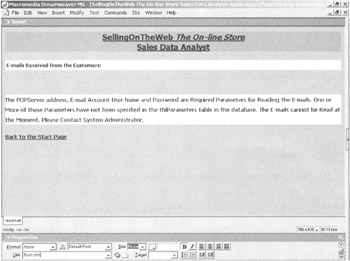
Figure 29.4: The design of the View Customer E-Mail page.
|
EAN: 2147483647
Pages: 200