Types of Charts
|
ColdFusion MX allows you to create nine types of two-dimensional and three-dimensional charts. These include
-
Horizontal bar chart
-
Line chart
-
Area chart
-
Pie chart
-
Cone chart
-
Pyramid chart
-
Curve chart
-
Scatter chart
-
Step chart
Here's the code to create a bar chart:
<!--- barchart.cfm template ---> <HTML> <HEAD> <TITLE>Bar chart - example</TITLE> </HEAD> <BODY> <H2>Bar Chart</H2> <CFCHART SHOW3D="yes" FONTSIZE ="16" GRIDLINES = "4" SCALETO="100000"> <CFCHARTSERIES TYPE="Bar"> <CFCHARTDATA ITEM="Production" VALUE="600000"> <CFCHARTDATA ITEM="Admin" VALUE="420000"> <CFCHARTDATA ITEM="Accounts" VALUE="570000"> <CFCHARTDATA ITEM="Marketing" VALUE="810000"> </CFCHARTSERIES> </CFCHART> <BR> </BODY> </HTML>
The preceding code creates a bar chart, as shown in Figure 26.2.
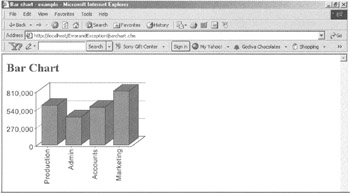
Figure 26.2: A bar chart.
Here's the code to create a pie chart:
<!--- piechart.cfm template ---> <HTML> <HEAD> <TITLE>Pie chart - example</TITLE> </HEAD> <BODY> <H2>Pie Chart</H2> <CFCHART SHOW3D="yes" TIPSTYLE="mousedown" FONT="Times" FONTSIZE="14" BACKGROUNDCOLOR="white"> <CFCHARTSERIES TYPE="Pie" COLORLIST="red,blue,yellow,green" PIESLICESTYLE="solid"> <CFCHARTDATA ITEM="Production" VALUE="600000"> <CFCHARTDATA ITEM="Admin" VALUE="420000"> <CFCHARTDATA ITEM="Accounts" VALUE="570000"> <CFCHARTDATA ITEM="Marketing" VALUE="810000"> </CFCHARTSERIES> </CFCHART> <BR> </BODY> </HTML>
The preceding code creates a pie chart, as shown in Figure 26.3.
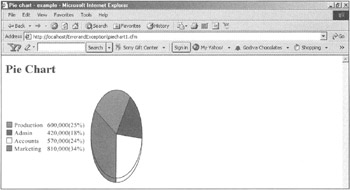
Figure 26.3: A pie chart.
Here's the code to create an area chart:
<!--- areachart.cfm template ---> <HTML> <HEAD> <TITLE>Area chart - example</TITLE> </HEAD> <BODY> <H2>Area Chart</H2> <CFCHART SHOW3D="yes" BACKGROUNDCOLOR="white" CHARTWIDTH="400"> <CFCHARTSERIES TYPE="Area"> <CFCHARTDATA ITEM="Production" VALUE="600000"> <CFCHARTDATA ITEM="Admin" VALUE="420000"> <CFCHARTDATA ITEM="Accounts" VALUE="570000"> <CFCHARTDATA ITEM="Marketing" VALUE="810000"> </CFCHARTSERIES> </CFCHART> <BR> </BODY> </HTML>
The preceding code creates an area chart, as shown in Figure 26.4.
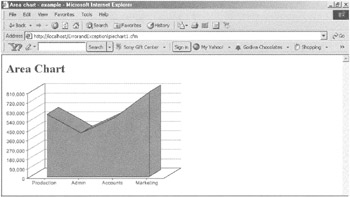
Figure 26.4: An area chart.
|
ColdFusion MX Professional Projects
ISBN: 1592000126
EAN: 2147483647
EAN: 2147483647
Year: 2002
Pages: 200
Pages: 200
Authors: Rohit Kochar, Parag Rastogi