Creating a Chart
|
You can use the <cfchart>, <cfchartseries>, and <cfchartdata> tags to create different types of charts. The <cfchart> tag specifies the container that holds the charts. The attributes of this container that you can set are height, width, background, color, labels, fonts, and various other chart characteristics.
The <cfchart> tag must have at least one <cfchartseries> tag. The <cfchartseries> tag specifies a database query that supplies the data to the chart. It also specifies the chart type, colors, and other optional attributes.
The <cfchartdata> tag specifies the individual data points to the <cfchartseries> tag. The code to create a chart is as follows:
<CFCHART ATTRIBUTES> <CFCHARTSERIES TYPE=" type of series OTHER OPTIONAL ATTRIBUTES> <!--- THIS TAG IS OPTIONAL ---> <CFCHARTDATA VALUE="Values" OTHER OPTIONAL ATTRIBUTES AS PER THE REQUIREMENT> </CFCHARTSERIES> </CFCHART>
You need to know all the attributes of the <cfchart> tag before you build a chart. Table 26.2 lists the attributes of this tag.
| Attribute | Description | Default Value |
|---|---|---|
| Format | Specifies the file format in which the graph is saved. There are three formats available: flash, jpg, and png. | Flash |
| ChartHeight | Specifies the chart height in pixels. | 240 |
| ChartWidth | Specifies the chart width in pixels. | 320 |
| ScaleFrom | Specifies the minimum integer value of Y-axis. | Determined from the data |
| ScaleTo | Specifies the maximum integer value of Y-axis. | Determined from the data |
| ShowXGridlines | Specifies whether to display X-axis gridlines. | No |
| ShowYGridlines | Specifies whether to display Y-axis gridlines. | Yes |
| Gridlines | Specifies the number of gridlines to display on value axis. | 3 (one at the top, one at the bottom, and zero) |
| SeriesPlacement | Specifies the relative position of the series for the charts having more than one data series. It can take default, cluster, stacked, and percent as values. | Default |
| ForegroundColor | Specifies the color of the text, gridlines, and labels. The colors are specified in hexadecimal format. | Black |
| DatabackgroundColor | Specifies the color of the area around the chart data. The colors use the hexadecimal naming system. | White |
| BorderbackgroundColor | Specifies the color of the area between the background and the border, on the labels, and around the legend. The colors use the hexadecimal naming system. | White |
| ShowBorder | Specifies whether to display the border. It can take Boolean values. | No |
| Font | Specifies the type of font style. It can take arial, times, courier, and arialunicodeMS values. ArialunicodeMS is used with a double-byte character set on UNIX or a double-byte character set on Windows with file type of flash. | Arial |
| FontSize | Specifies the size of the font. It can take integer values. | 11 |
| FontBold | Specifies whether or not the font will be bold. | No |
| FontItalic | Specifies whether or not the font will be italic. | No |
| LabelFormat | Specifies the format for Y-axis labels. It takes number, currency, percent, and date formats. | Number |
| XaxisTitle | Specifies X-axis title text. | |
| YaxisTitle | Specifies Y-axis title text. | |
| SortXAxis | Specifies whether or not to display column labels in alphabetic order a long the X-axis. | No |
| Show3D | Specifies whether or not to give the chart a three-dimensional appearance. | No |
| Xoffset | Specifies the number of units by which to display the chart as angled horizontally. You must set the show3D attribute to Yes before setting the Xoffset attribute. The number can range from -1 (90 degrees left) to 1 (90 degrees right). | 0.1 |
| Yoffset | Specifies the number of units by which to display the chart as angled vertically. You must set the Show3D attribute to Yes before setting the Yoffset attribute. The number can range from -1 (90 degrees down) to 1 (90 degrees up). | 0.1 |
| Rotated | Setting this value to Yes rotates the chart by 90 degrees. You can use this option for a horizontal bar chart. | No |
| ShowLegend | Setting this value to Yes displays the legend for charts with more than one data series. | Yes |
| TipStyle | Opens a pop-up window to display information about the current chart, depending on the action. The action MouseDown displays the tip if the user positions the cursor at the element and clicks the mouse. This action is for Flash format graph files only. The action MouseOver displays the text when the user positions the cursor at the element. The off action suppresses the display. | MouseOver |
| Tipbgcolor | Specifies the background color for the tip for Flash format graph files only. The colors use hex values and named colors. | White |
| ShowMarkers | Displays the markers at the data points for line, curve, and scatter values of the type attribute of the <chartseries> tag. | Yes |
| MarkerSize | Specifies the size of the point marker in pixels. It takes integer values. | Automatic |
| PieSliceStyle | Displays the pie chart type as solid or sliced. | Sliced |
| URL | Specifies the URL to open when the user clicks an item in a data series. You can use variables within the URL string. These variables include $value$, which has the value of the selected row, $itemlabel$, which has the label of the selected label, and $serieslabel$, which has the label of the selected series. The variables remain empty if no value is selected. | |
| Name | Specifies the page variable name. It takes string values, and it returns ISO-8859-1 encoded binary graph data and sets it as a variable in the page. It's mainly used by Flash gateway users and also suppresses the chart display. |
Here's the syntax for the <cfchart> tag:
<CFCHART FORMAT = "flash, jpg, png" CHARTHEIGHT = "integer number of pixels" CHARTWIDTH = "integer number of pixels" SCALEFROM = "integer minimum value" SCALETO = "integer maximum value" SHOWXGRIDLINES = "yes" or "no" SHOWYGRIDLINES = "yes" or "no" GRIDLINES = "integer number of lines" SERIESPLACEMENT = "default, cluster, stacked, percent" FOREGROUNDCOLOR = "Hex value or Web color" DATABACKGROUNDCOLOR = "Hex value or Web color" BORDERBACKGROUNDCOLOR = "Hex value or Web color" SHOWBORDER = "yes" or "no" FONT = "font name" FONTSIZE = "integer font size" FONTBOLD = "yes" or "no" FONTITALIC = "yes" or "no" LABELFORMAT = "number, currency, percent, date" XAXISTITLE = "title text" YAXISTITLE = "title text" SORTXAXIS = "yes/no" SHOW3D = "yes" or "no" XOFFSET = "number between -1 and 1" YOFFSET = "number between -1 and 1" ROTATED = "yes/no" SHOWLEGEND = "yes/no" TIPSTYLE = "MouseDown, MouseOver, Off" TIPBGCOLOR = "hex value or web color" SHOWMARKERS = "yes" or "no" MARKERSIZE = "integer number of pixels" PIESLICESTYLE = "solid, sliced" URL = "onClick destination page" NAME = "String" </CFCHART>
The <cfchartseries> tag is nested within the <cfchart> tag. This tag specifies the style of the chart's appearance, such as bar, line, and pie. Table 26.3 lists the attributes of this tag.
| Attribute | Description | Required? |
|---|---|---|
| Type | Specifies the display of the chart. It takes the bar, line, pyramid, area, cone, curve, cylinder, step, scatter, and pie values. | Yes |
| Query | Specifies the query from which the data should be received. | No |
| ItemColumn | Specifies the name of the query column of the query attribute, which provides the item label for graph. | Required for query attribute |
| ValueColumn | Specifies the name of the query column of the query attribute, which contains the data values to the graph. | Required for query attribute |
| SeriesLabel | Specifies the text of the data series label. | No |
| SeriesColor | Specifies the color of the main elements of the charts, such as the bars for a bar chart. It supports the named colors and Hex values. | No |
| PaintStyle | Sets the paint display style of the data series. It can be plain, raise, shade, or light. The default value is plain. | No |
| MarkerStyle | Sets the icon to mark a data point for line, curve, and scatter and show3D types. It can be rectangle, triangle,diamond,circle,letter,mcross, snow, or rcross. The default value is rectangle. | No |
| ColorList | Sets the pie slice colors for the pie charts. | No |
Here's the syntax of the <cfchartseries> tag:
<CFCHARTSERIES TYPE="type" QUERY="queryName" ITEMCOLUMN="queryColumn" VALUECOLUMN="queryColumn" SERIESLABEL="Label Text" SERIESCOLOR="Hex value or Web color" PAINTSTYLE="plain, raise, shade, light" MARKERSTYLE="style" COLORLIST = "list"> </CFCHARTSERIES>
Table 26.4 lists the attributes of the <cfchartdata> tag:
| Attribute | Description |
|---|---|
| Item | Specifies the names of the data points and takes string values. |
| Value | Specifies data point values and takes numbers or expressions. |
Here's the syntax for the <cfchartdata> tag:
<CFCHARTDATA ITEM = "text" VALUE = "number">
The following is the code to create a simple chart:
<!--- Simplechart.cfm template ---> <HTML> <HEAD> <TITLE>EXAMPLE OF CREATING A CHART</TITLE> </HEAD> <BODY> <H1>Example of Creating a Chart </H1> <CFCHART> <CFCHARTSERIES TYPE="PIE"> <CFCHARTDATA ITEM="First Series" VALUE=500000> <CFCHARTDATA ITEM="Second Series" VALUE=250000> <CFCHARTDATA ITEM="Third Series" VALUE=300000> <CFCHARTDATA ITEM="Fourth Series" VALUE=400000> </CFCHARTSERIES> </CFCHART> <BR> </BODY> </HTML>
Figure 26.1 shows the output of the preceding code.
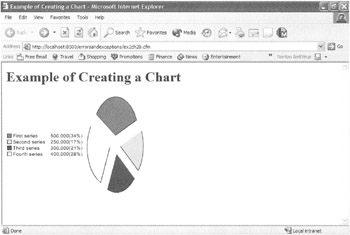
Figure 26.1: Example of creating a chart.
|
EAN: 2147483647
Pages: 200