Monitoring Database Mirroring
There are different ways to monitor database mirroring, based on what information you are looking for. For basic information about the database mirroring state, safety level, and witness status, you can use catalog views. You can refer to the "Database Mirroring Catalog Views" section for more details about catalog views. To monitor the performance of database mirroring, SQL Server provides a set of System Monitor performance objects. There is also a GUI "Database Mirroring Monitor" available with SQL Server Management Studio, which you can access if your database is mirrored. We will discuss the key System Monitor counters and then the GUI in this section.
Monitoring Using System Monitor
The object SQL Server: Database Mirroring has plenty of counters to monitor database mirroring performance. You can use these counters to monitor the database mirroring activities on each partner and also the traffic between them. See Figure 17-4. You can use these counters for each database instance, so if you are mirroring more than one database on a server, select the database you want to monitor from the list box. Below are the key counters.
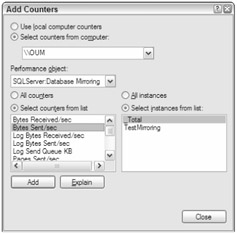
Figure 17-4
Counters for the Principal
The following counters can be used on the principal server:
-
Log Bytes Sent/Sec: This counter will tell you the rate at which the principal is sending transaction-log data to the mirror.
-
Log Send Queue KB: The total kilobytes of the log that have not been sent to the mirror server yet. As the transaction-log data is sent from the principal to the mirror, the Log Send Queue will be depleted and will grow as new transactions are recorded into the log buffer on the principal.
-
Transaction Delay: The delay (in milliseconds) in waiting for commit acknowledgement from the mirror. This counter reports the total delay for all the transactions in process at the time. You can determine the average delay per transaction by dividing this counter by the Transactions/sec counter. In high-performance mode, this counter will always be zero. Make sure to choose the database instance you are interested in for this counter.
Do a simple exercise using the InsertData.sql script from earlier to get a feel for how this counter tells you the delay in transaction. Start the Performance Monitor and add this counter on your principal. Run the script. Note the average for this counter. It will show some value greater than 0. Then run the command ALTER DATABASE TestMirroring SET SAFETY OFF on the principal. This will put database mirroring in high-Performance mode. Now run the script again. You will notice that the counter would reflect 0.
-
Transaction/Sec: You will find this counter in the Database object. This counter measures database throughput and shows many transactions are processed in a second. This counter gives you an idea of how fast the log file will grow if your mirror is down, the mirror state is DISCONNECTED, and you need to expand the log file. Make sure to choose the database instance you are interested in for this counter.
-
Log Bytes Flushed/Sec: This counter is under the Database object. This counter tells you how many bytes are written to disk (log hardening) per second on the principal. This is the log-generation rate of your application. These are also the bytes sent to the mirror at the time it is flushed to the disk on the principal. In normal operating conditions, the Log Bytes Flushed/Sec and Log Bytes Sent/Sec counters would show same number. If you look at Figure 17-2, the activity labeled 2 happens at the same time, and that is exactly what the Performance Monitor tells you.
Counters for Mirror
The following counters can be used on the mirror server:
-
Redo Bytes/Sec: This counter tells you the rate at which log bytes are rolled forward (replayed) to the data pages per second from the redo queue.
-
Redo Queue KB: This counter shows the total KB of the transaction log still to be applied to the mirror database (rolled forward). You will see later how to calculate the estimated time the mirror will take to redo the logs using this counter and the Redo Bytes/Sec counter. The failover time will depend on how big this queue is and how fast the mirror can empty this queue.
-
Log Bytes Received/Sec: This counter will tell you the rate at which log bytes are received from the principal. If the mirror can keep up with principal to minimize the failover time, ideally the Log Bytes Received/Sec and Redo Bytes/Sec counter will show the same average value, which means that the Redo Queue KB is zero. Whatever bytes the principal has sent are immediately rolled forward to the data pages on the mirror and there is no redo left, so the mirror is ready to failover right now.
From a DBA standpoint, we would like to know approximately how far the mirror is behind the principal and once mirror catches up how long would it take to redo the transaction log so that it can failover. There is some calculation required, which we can tell you about, but also, there is the Database Mirroring Monitor tool, which ships with SQL Server and can give you all this information readily. We will look at that tool in a moment. First, we'll describe the calculations, so you know how they are calculated in the tool.
To calculate the estimated time for mirror to catch up (in seconds) with principal, you can use the Log Send Queue counter from the principal and the Log Bytes Received/Sec counter on the mirror. You can also use Log Bytes Send/Sec counter on the principal instead of Log Bytes Received/Sec on the mirror. Use the average value. The following is the calculation:
Estimated time to catch up (in seconds) = (Log Send Queue)/ (Log Bytes Received /sec)
To calculate the estimated time for the mirror to replay the transaction log (redo) in order to get ready for failover, you can use the Redo Queue KB counter (this counter gives you KB value, so convert it to Bytes) and the Redo Bytes/Sec counter on mirror. Use the average value. The following is the calculation:
Estimated time to redo (in seconds) = (Redo Queue)/ (Redo Bytes/sec)
Monitoring Using Database Mirroring Monitor
The database mirroring development team in SQL Server came up with this really nice tool to monitor the database mirroring activities that will make the DBA's life very easy. You can access this tool by running sqlmonitor.exe from the command prompt and then selecting GoDatabase Mirroring Monitor, or you can right-click any user database in Object Explorer in SQL Management Studio on any registered SQL Server 2005 machine and select TasksLaunch Database Mirroring Monitor. The Database Mirroring Monitor is shown in Figure 17-5.
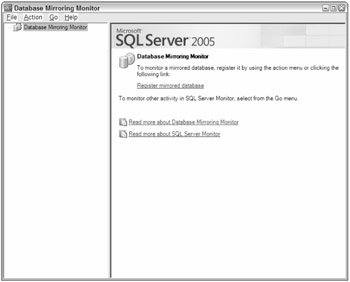
Figure 17-5
You can monitor all your mirroring sessions here. You have to register the mirrored database in this tool before you can use it. You can do that by clicking ActionRegister Mirrored Database, and then just follow the wizard. You can give the wizard either the principal server name or the mirror server name, and it will figure out the other. Figure 17-6 shows the Database Mirroring Monitor with a registered mirrored database.
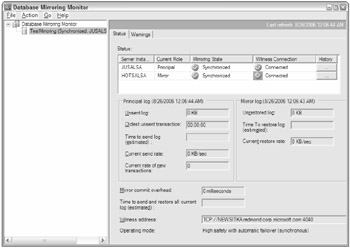
Figure 17-6
You can monitor the key counters we mentioned in the previous section using this GUI. You can also set alerts for these counters to get an e-mail or take an action if they exceed a set threshold, which you will see later.
If you set up mirroring using the SQL Management Studio, it creates the SQL job called Database Mirroring Monitor Job, which runs every one minute by default to refresh these counters. This data is stored in the msdb.dbo.dbm_monitor_data table. You can change the job schedule if you want to. If you set up database mirroring using the scripts we provided, you can create the SQL job using the following command to refresh the counters:
sp_dbmmonitoraddmonitoring [ update_period ] The [ update_period ] by default is one minute. You can specify a value between 1 and 120, in minutes. If you do not create this job, you just have to press F5 when you are on the Database Mirroring Monitor screen. It will call the sp_dbmmonitorresults stored procedure to refresh the data (adding a row for new readings) in the msdb.dbo.dbm_monitor_data table. Actually, sp_dbmmonitorresults calls another stored procedure in the msdb database called sp_dbmmonitorupdate to update the status table and calculate the performance matrix displayed in the UI. If you hit F5 more than once in 15 seconds, it will not refresh the data in the table.
Take a look at the Status screen details in Figure 17-6. The status area where the server instance names, their current role, mirroring state, and witness connection status (if there is a witness) comes from the catalog view sys.database_mirroring. If you click the History button, it will give you the history of the mirroring status and other performance counters based on how far you want to go. The mirroring status and performance history is kept for seven days (168 hrs) by default in the msdb.dbo.dbm_monitor_data table. If you want to change the retention period, you can use the sp_dbmmonitor changealert stored procedure, like this:
EXEC sp_dbmmonitorchangealert TestMirroring, 5, 8, 1 This example will change the retention period to eight hours for the TestMirroring database. You can refer to BOL for a description of this stored procedure.
Principal Log: Unsent Log
This counter will provide the same value as the Log Send Queue KB counter on the principal. Unsent Log will read the last value, so if you want to compare the Performance Monitor and this counter, look at the last value. You can run the script InsertData.sql from earlier in the chapter after suspending the mirroring session using the ALTER DATABASE TestMirroring SET PARTNER SUSPEND command, and you will see that this counter value will start going up.
Principal Log: Oldest Unsent Transaction
This counter will give you the age in hh:mm:ss format of the oldest unsent transaction sitting in the Send Queue. It means that the mirror is behind the principal by that much time.
Principal Log: Time to Send Log (Estimated)
This counter will give you the estimated time the principal instance requires to send the log to that is currently in the Send Queue to the mirror server. Because the rate of the incoming transaction can change, this counter can only give you an estimate. This counter will give you a rough estimate of the time it will require to manually failover. If you suspend the mirroring, you will notice that this counter will show a value of "Infinite," which means that since you are not sending any transaction logs to the mirror, the mirror will never catch up.
Principal Log: Current Send Rate
This counter gives you the rate at which the transaction log is sent to the mirror in KB/Sec. This is the same as the Performance Monitor counter Log Bytes Sent/Sec. The counter Current Send Rate gives you the value in KB, whereas the counter Log Bytes Sent/Sec gives the value in bytes. When Time to Send Log is infinite, this counter will show a value of 0 KB/Sec because no log is being sent to the mirror.
Principal Log: Current Rate of New Transaction
This counter gives you the rate at which new transactions are coming in per second. This is same as the Transaction/sec counter in Database objects.
Mirror Log: Unrestored Log
This counter is for mirror server and will give you the amount of log in KB sitting in the Redo Queue yet to be restored. This is the same as the Redo Queue KB counter for the mirror server. If this counter is 0, the mirror is keeping up with the principal and can failover right away, if necessary.
Mirror Log: Time to Restore Log
This counter gives you an estimate, in minutes, of how long the mirror will take to replay the transaction sitting in the Redo Queue. We have done this calculation above. This is the estimate time that the mirror will require before failover.
Mirror Log: Current Restore Rate
This counter gives the rate at which the transaction log is restored into the mirror database in KB/Sec.
Mirror Committed Overhead
This counter measures the delay (in milliseconds) in waiting for a commit acknowledgement from the mirror. This counter is the same as the Transaction Delay on the principal. This counter is relevant only in high-safety mode. For high-performance mode, this counter will be zero because the principal does not wait for the mirror to harden the log to disk.
Time to send and restore all current Log (Estimated)
This counter measures the time needed to send and restore all of the logs that have been committed at the principal as of the current time. This time may be less than the sum of the values of the Time to send log (estimated) and Time to restore log (estimated) fields, because sending and restoring can operate in parallel. This estimate does predict the time required to send and restore new transactions committed at the principal while working through backlogs in the Send Queue.
Witness Address
This field shows you the fully qualified domain name of the witness with the port number assigned for that endpoint.
Operating Mode
This field shows the operating mode of the database mirroring session, one of the following:
-
High performance (asynchronous)
-
High safety without automatic failover (synchronous)
-
High safety with automatic failover (synchronous)
Setting Threshold on Counters and Sending Alerts
You can set the warning for different mirroring thresholds so you will receive alerts based on the threshold you have set. Figure 17-7 shows the Warnings tab.
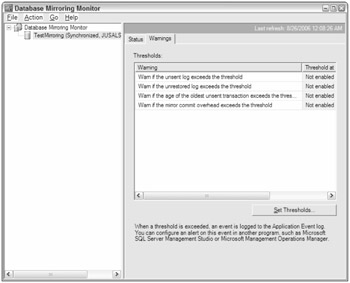
Figure 17-7
There are different warnings for which you can set the thresholds. You can set the alert using SQL Server Management Studio for this event. To learn how to set Alerts, refer to Chapter 5. We will give you a quick summary of how to set the alerts here. Start by clicking the Set Thresholds button to open the window shown in Figure 17-8.
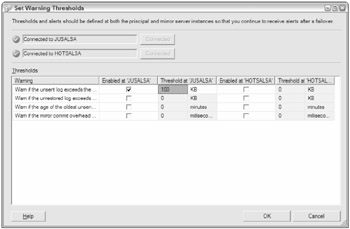
Figure 17-8
You can see that you can set the threshold for counters on both the principal and mirror servers individually so that you can either keep the threshold the same or different based on your needs. For this example, select the checkbox for the first warning, "Warn if the unsent log exceeds the threshold," and set the threshold value to 100 KB, just for the principal server.
Now under Alert folder in SQL Server Agent in SQL Management Studio, add a new alert. You will see a screen similar to the one shown in Figure 17-9. Type the name for your alert. Select the database name for which you need this alert, in this case, TestMirroring. Now SQL Server will raise the error when the threshold you set is exceeded. The error number is 32042, so type that error number. You can refer to the section "Using Warning Thresholds and Alerts on Mirroring Performance Metrics" in Books Online to get the error numbers for other events. Now click the Response on left pane and fill out the information of the operator who will receive the alert when the threshold is exceeded. That's it. You can test this alert by suspending the database mirroring using the ALTER DATABASE TestMirroring SET PARTNER SUSPEND on the principal. The log will not be sent to the mirror and the Unsent Log counter will start increasing. Once it reaches the threshold of 100KB, you should get the alert. We will look at an example of how to set up the database mirroring event change (suspended, synchronizing, synchronized) and send a notification later in the section titled "Mirroring Event Listener Example."
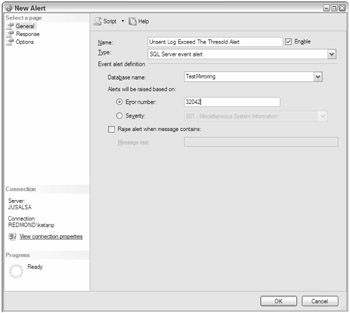
Figure 17-9
Monitoring using SQL Profiler
SQL Server 2005 Profiler contains one event class for database mirroring, the Database: Database Mirroring State Change event. This event will record all the database mirroring state changes (suspended, synchronizing, synchronized, and so on) that happen on the server.
EAN: 2147483647
Pages: 193