Troubleshooting the Network Layers
| When you understand the layers involved in the applicable network, you can focus upon layers as needed to find and remedy the networking problem. The most fundamental place to begin looking for a networking problem is in the lowest layer. Then you work your way up through the subsequent layers. Therefore, problem solving typically begins at the first, or physical (also known as "hardware"), layer. Thus, our discussion begins there too. We then discuss troubleshooting at the subsequent layers. Note that although other suites exist, this discussion of layers centers upon the TCP/IP suite of protocols. Also be aware that unless otherwise noted, this discussion of troubleshooting in the network layers refers to the TCP/IP model, so any references to layers refer to the four layers of that model. References to the OSI model are noted expressly as such in this discussion. Troubleshooting the TCP/IP Physical Network Access LayerBecause this layer consists of several aspects encompassing everything from the hardware to the MAC protocol, we have divided this discussion into smaller sections. We begin by discussing the physical connection and then move through the process before ending with a discussion of Address Resolution Protocol (ARP). Physical AspectsAt the outset, note that this layer usually is external to the box (except the network adaptor) and is independent of the Linux kernel itself. However, a problem with this layer can cause significant disruption of subsequent layer functioning. As mentioned previously, the hardware layer defines the characteristics of the physical medium used for the network. This includes not only cable type and pinouts but also power modulation, bit encoding, carrier signals, and bit synchronization, among other elements. The hardware also includes switches, routers, and even converters. The first step in determining whether there is a problem at the hardware layer is to look for the link light. If the light is not on, there is a problem at the physical layer. The physical layer incorporates cooperation between the driver and the interface card to bring the interface online. If the light is on, a problem at the physical layer still might exist because there could be cross-talk on the wire due to pins not being on the correct pair of the copper twisted-pair (cross-talk can also be due to the quality of the wire) or because an incorrect driver is being used, lighting the link light but not performing other necessary functions. If you suspect a problem at the hardware layer, the culprit could be a number of things, some internal and some external. Externally, a problem can occur because of a bad cable, switch, or hub. A system administrator normally would engage a network engineer to assist in troubleshooting this type of problem. Internally, an incorrect driver might be bound to the interface card, or the interface card simply might be bad. Confirm that the hardware and the operating system's driver support the card before proceeding. Then try another network card. Confirm that other network adapters can use the same cable and switch ports. If the hardware is the problem, replace it. If the problem is not resolved after troubleshooting different cards, and the card and the driver required to operate the device are supported by both the computer vendor and the Linux kernel, you must engage assistance from the network engineers who maintain the network hardware. You can also contact the vendor to determine whether a patch is necessary. Finally, note that it is possible to experience symptoms in higher layers of the TCP/IP model caused by switch firmware issues at the hardware layer. Later in this chapter, we give an example of such a case. Link Aspects: Network InterfacesAfter the cables and switches have been successfully tested, we move on to troubleshooting the link. Under the OSI model, this is the second layer; however, both the OSI physical and link layers are contained within the physical layer of the TCP/IP model. In either case, this is the layer at which the magical link light appears on the interface. The next step in troubleshooting a link problem is to verify that the link light is on and that the kernel sees the card. Confirm that the kernel recognizes the Ethernet adapter(s) on the system and that drivers are bound to the interface(s). Some examples of such a confirmation process follow. An IA-32 machine with a Broadcom network interface yields something like the following: #dmesg | grep eth eth0: Tigon3 [partno(N/A) rev 1002 PHY(5703)] (PCI:33MHz:32-bit) 10/100/1000BaseT Ethernet 00:0e:7f:b4:27:aa tg3: eth0: Link is up at 100 Mbps, full duplex. tg3: eth0: Flow control is on for TX and on for RX In this situation, eth0 is using the Tigon3 driver. If the kernel message buffer has been overwritten with other messages already, use lspci or the /proc filesystem, as shown next. Note that in this example, we display the same hardware as previously; however, lspci does not show the driver binding. # lspci 00:00.0 Host bridge: ServerWorks CNB20-HE Host Bridge (rev 32) 00:00.1 Host bridge: ServerWorks CNB20-HE Host Bridge 00:00.2 Host bridge: ServerWorks CNB20-HE Host Bridge 00:01.0 Communication controller: Conexant HCF 56k Data/Fax/Voice Modem (Worldwide) (rev 08) 00:02.0 SCSI storage controller: Adaptec AHA-3960D / AIC-7899A U160/m (rev 01) 00:02.1 SCSI storage controller: Adaptec AHA-3960D / AIC-7899A U160/m (rev 01) 00:03.0 VGA compatible controller: ATI Technologies Inc Rage XL (rev 27) 00:04.0 Ethernet controller: Broadcom Corporation NetXtreme BCM5702 Gigabit Ethernet (rev 02) 00:05.0 System peripheral: Compaq Computer Corporation Advanced System Management Controller 00:0f.0 ISA bridge: ServerWorks CSB5 South Bridge (rev 93) 00:0f.1 IDE interface: ServerWorks CSB5 IDE Controller (rev 93) 00:0f.2 USB Controller: ServerWorks OSB4/CSB5 OHCI USB Controller (rev 05) 00:0f.3 Host bridge: ServerWorks GCLE Host Bridge 00:11.0 Host bridge: ServerWorks: Unknown device 0101 (rev 05) 00:11.2 Host bridge: ServerWorks: Unknown device 0101 (rev 05) With older kernels, the only location that depicts the device along with the driver bound to that device is dmesg or the log file /var/log/dmesg. With the newer kernels built for the IA-64 platform, the file /proc/ioports does a great job of showing the Domain:Bus:slot.function and the driver for the device. The following is an example of lspci and cat /proc/ioports on an IA-64 machine running the 2.6.5 kernel release. Notice that by using these two commands, we can determine the hardware address of the interface and the driver that is bound to the hardware path. # lspci 0000:00:00.0 Serial controller: Hewlett-Packard Company Diva Serial [GSP] Multiport UART (rev 02) 0000:00:01.0 Ethernet controller: Digital Equipment Corporation DECchip 21142/43 (rev 41) ... # cat /proc/ioports 00000000-00000fff : PCI Bus 0000:00 00000060-0000006f : i8042 00000d00-00000d7f : 0000:00:01.0 00000d00-00000d7f : tulip ... Link Aspects: ConfigurationNow that we have a list of the Ethernet adapters, we can confirm their link states by using user-level applications, which perform the necessary ioctls. A couple commands that provide this functionality are mii-tool and ethtool. These tools do not support every network adapter, but they support many. You must note some caveats about these tools. Network drivers detect link status in a couple ways. Some drivers use the Media Independent Interface (MII) to detect the link status by reading an interface register. Others, such as the driver in the previous example (tg3), use the adapter's last known state. In short, performing an ifdown on an interface with the tg3 driver results in no link detected. In this case, that means only that the interface has been disabled, not that a cable is not present. The interface might never have been enabled; therefore, you would not know whether a cable was connected to the interface. The cable presence could be confirmed by simply attempting to bring the interface online with ifup. An example of link detection follows: # mii-tool eth0 SIOCGMIIPHY on 'eth0' failed: Operation not supported This failed because the driver of this interface does not support the mii-tool's query. However, using ethtool on the same device, we see the following: # ethtool eth0 Settings for eth0: Supported ports: [ MII ] Supported link modes: 10baseT/Half 10baseT/Full 100baseT/Half 100baseT/Full 1000baseT/Half 1000baseT/Full Supports auto-negotiation: Yes Advertised link modes: 10baseT/Half 10baseT/Full 100baseT/Half 100baseT/Full 1000baseT/Half 1000baseT/Full Advertised auto-negotiation: Yes Speed: 100Mb/s Duplex: Full Port: Twisted Pair PHYAD: 1 Transceiver: internal Auto-negotiation: on Supports Wake-on: g Wake-on: d Current message level: 0x000000ff (255) Link detected: yes Bringing the device down can give you misleading results if you do not know what to expect. With the tg3 driver, as mentioned previously, ethtool can detect only the interface's last configuration, unlike mii-tool, which can read the interface register to determine whether the carrier signal is present. See the following example: # ifdown eth0 # ethtool eth0 Settings for eth0: Supports Wake-on: g Wake-on: d Current message level: 0x000000ff (255) Link detected: no Here we know that the link is valid and that the cable is in good working order. However, when the user-level command takes the card offline, it sets the link status to "not present." Note that other drivers behave differently, and some drivers still are not supported with these tools. After the cable is confirmed, it is up to the interface's chipset and the adaptor's driver to bring the network card online. The physical layer accomplishes this task by placing a carrier signal on a wire (pin). When the cable is connected to the Ethernet card, the chipset generates an external interrupt. This is when the kernel driver initiates a netif_carrier_ok(), causing the driver to bring the interface online. If the hardware layer is not set up properly (that is, the wires are not aligned properly), the link might come online, yet you might experience high network traffic loss. An example of this would occur if the twisted pairs were not aligned properly with the other end of the cable, resulting in cross-talk. For example, pins 2 and 5 should be a twisted pair for standard Ethernet. After the link is brought online, the next step is for the driver to negotiate speed and duplex. Most drivers leave this task to an auto-negotiation between the driver and the device at the other end. However, the duplex and speed of the connection can be changed during driver module installation or at the user level by running tools such as the aforementioned mii-tool and ethtool. Next is an illustration of changing the interface's speed and duplex with mii-tool: # mii-tool -v eth0: 100 Mbit, full duplex, link ok product info: TDK 78Q2120 rev 11 basic mode: 100 Mbit, full duplex basic status: link ok capabilities: 100baseTx-FD 100baseTx-HD 10baseT-FD 10baseT-HD advertising: 100baseTx-FD 100baseTx-HD 10baseT-FD 10baseT-HD # mii-tool -F 10baseT-FD # mii-tool -v eth0: 10 Mbit, full duplex, link ok product info: TDK 78Q2120 rev 11 basic mode: 10 Mbit, full duplex basic status: link ok capabilities: 100baseTx-FD 100baseTx-HD 10baseT-FD 10baseT-HD advertising: 100baseTx-FD 100baseTx-HD 10baseT-FD 10baseT-HD An example of using a similar approach with the ethtool command with an interface that uses the tg3 driver follows. First we confirm the interface and driver used by the interface. # grep eth0 /var/log/dmesg eth0: Tigon3 [partno(N/A) rev 1002 PHY(5703)] (PCI:33MHz:32-bit) 10/100/1000BaseT Ethernet 00:0e:7f:b4:27:aa Using ethtool, we determine the driver's capabilities. # ethtool eth0 Settings for eth0: Supported ports: [ MII ] Supported link modes: 10baseT/Half 10baseT/Full 100baseT/Half 100baseT/Full 1000baseT/Half 1000baseT/Full Supports auto-negotiation: Yes Advertised link modes: 10baseT/Half 10baseT/Full 100baseT/Half 100baseT/Full 1000baseT/Half 1000baseT/Full Advertised auto-negotiation: Yes Speed: 100Mb/s Duplex: Full Port: Twisted Pair PHYAD: 1 Transceiver: internal Auto-negotiation: on Supports Wake-on: g Wake-on: d Current message level: 0x000000ff (255) Link detected: yes We change the interface to HD, 10Mbps, and turn auto-negotiation off. # ethtool -s eth0 speed 10 duplex half autoneg off We check dmesg for driver messages. # dmesg ... tg3: eth0: Link is down. tg3: eth0: Link is up at 10 Mbps, half duplex. tg3: eth0: Flow control is on for TX and on for RX. Now that the users are complaining that the machine is slow, we can take it back to 100Mbps, using auto-negotiation. # ethtool -s eth0 autoneg on We confirm with dmesg that the driver took the card back to 100Mbps, full duplex. # dmesg ... tg3: eth0: Link is down. tg3: eth0: Link is up at 100 Mbps, full duplex. tg3: eth0: Flow control is on for TX and on for RX. Changing the speed and duplex of a Linux network interface is easy with these userlevel commands; however, these changes are not persistent. Making the changes persist across reboots can be accomplished in several ways. One way is to create a startup script that calls these user-level tools to make the changes to the interface. Some distributions have modified the ifup script to read variables such as ETHTOOL_OPTS="speed 1000 duplex full"; however, this is the case with neither all distributions nor all versions of those distributions. If the interface's driver is a module, configuring the interface's speed and duplex can be done by modifying /etc/modules.conf with the 2.4 kernel release and /etc/modprobe.conf with the 2.6 kernel release. The following is an example of the default modules.conf file on a 2.4 kernel release using the tg3 driver. # cat /etc/modules.conf probeall scsi_hostadapter aic7xxx imm ppa probeall usb-interface usb-ohci alias eth0 tg3 To configure the interface to auto-negotiation off, speed 100Mbps, and full duplex, all that is required is the following: # cat /etc/modules.conf probeall scsi_hostadapter aic7xxx imm ppa probeall usb-interface usb-ohci alias eth0 tg3 post-install tg3 /usr/sbin/ethtool -s eth0 speed 100 duplex full autoneg off Following are the same interface and driver with the 2.6 kernel release using the modprobe.conf file. # cat /etc/modprobe.conf ... install eth1 /bin/true install tg3 /sbin/modprobe --ignore-install tg3 && /bin/sleep 2 && /usr/sbin/ethtool -s eth1 speed 100 duplex full autoneg off Note that the sleep statement was added to allow time for the driver to establish communication with the device before trying to change its speed and duplex. Test this modprobe setup with the following commands. # modprobe -r tg3 Note # modprobe -r tg3 removes the driver, so you must be on the console or communicating over another network interface that does not need this driver; otherwise, you can no longer communicate with this system. # modprobe -v tg3 install /sbin/modprobe --ignore-install tg3 && /bin/sleep 2 && /usr/sbin/ethtool -s eth1 speed 100 duplex full autoneg off insmod /lib/modules/2.6.5-7.97-default/kernel/drivers/net/tg3.ko Now we can view the settings with ethtool to see whether auto-negotiation is disabled. # ethtool eth1 Settings for eth1: Supported ports: [ MII ] Supported link modes: 10baseT/Half 10baseT/Full 100baseT/Half 100baseT/Full 1000baseT/Half 1000baseT/Full Supports auto-negotiation: Yes Advertised link modes: 10baseT/Half 10baseT/Full 100baseT/Half 100baseT/Full 1000baseT/Half 1000baseT/Full Advertised auto-negotiation: Yes Speed: 100Mb/s Duplex: Full Port: Twisted Pair PHYAD: 1 Transceiver: internal Auto-negotiation: off Supports Wake-on: g Wake-on: d Current message level: 0x000000ff (255) Link detected: yes In addition to specifying an additional command inside the module's configuration files, it also is possible to pass arguments along to some drivers. Of course, not all drivers support the use of options, which are very similar to command arguments. The tg3 driver is an example of such a driver. Other vendors have made their drivers accept options at load time, which can define speed and duplex. We recommend using the userlevel commands; however, if the drivers do not support these commands, you have little choice but to use the driver options. Using the modinfo command, we can see a driver's supported options and their meanings as illustrated next. This first example shows a driver that has no options: # modinfo tg3 filename: /lib/modules/2.4.19-16glt1/kernel/drivers/net/tg3.o description: "Broadcom Tigon3 ethernet driver" author: "David S. Miller (davem@redhat.com) and Jeff Garzik (jgarzik@mandrakesoft.com)" license: "GPL" parm: tg3_debug int, description "Tigon3 bitmapped debugging message enable value" From the previous output, we can determine that the driver has no driver options to set, so we must use the user-level tools to configure the interface. Next let's look at a driver that has options: # modinfo eepro100 filename: /lib/modules/2.4.19-16glt1/kernel/drivers/net/eepro100.o description: "Intel i82557/i82558/i82559 PCI EtherExpressPro driver" author: "Maintainer: Andrey V. Savochkin <saw@saw.sw.com.sg>" license: "GPL" parm: debug int, description "debug level (0-6)" parm: options int array (min = 1, max = 8), description "Bits 0-3: tranceiver type, bit 4: full duplex, bit 5: 100Mbps" parm: full_duplex int array (min = 1, max = 8), description "full duplex setting(s) (1)" parm: congenb int, description "Enable congestion control (1)" parm: txfifo int, description "Tx FIFO threshold in 4 byte units, (0-15)" parm: rxfifo int, description "Rx FIFO threshold in 4 byte units, (0-15)" parm: txdmacount int parm: rxdmacount int parm: rx_copybreak int, description "copy breakpoint for copy- only-tiny-frames" parm: max_interrupt_work int, description "maximum events handled per interrupt" parm: multicast_filter_limit int, description "maximum number of filtered multicast addresses" The e100 driver's options include the following: # modinfo e100 filename: /lib/modules/2.4.19-16glt1/kernel/drivers/net/e100/e100.o description: "Intel(R) PRO/100 Network Driver" author: "Intel Corporation, <linux.nics@intel.com>" license: "Dual BSD/GPL" parm: TxDescriptors int array (min = 1, max = 16), description "Number of transmit descriptors" parm: RxDescriptors int array (min = 1, max = 16), description "Number of receive descriptors" parm: XsumRX int array (min = 1, max = 16), description "Disable or enable Receive Checksum offload" parm: e100_speed_duplex int array (min = 1, max = 16), description "Speed and Duplex settings" parm: ucode int array (min = 1, max = 16), description "Disable or enable microcode loading" parm: ber int array (min = 1, max = 16), description "Value for the BER correction algorithm" parm: flow_control int array (min = 1, max = 16), description "Disable or enable Ethernet PAUSE frames processing" parm: IntDelay int array (min = 1, max = 16), description "Value for CPU saver's interrupt delay parm: BundleSmallFr int array (min = 1, max = 16), description "Disable or enable interrupt bundling of small frames" parm: BundleMax int array (min = 1, max = 16), description "Maximum number for CPU saver's packet bundling" parm: IFS int array (min = 1, max = 16), description "Disable or enable the adaptive IFS algorithm" parm: RxCongestionControl int array (min = 1, max = 16), description "Disable or enable switch to polling mode" parm: PollingMaxWork int array (min = 1, max = 16), description "Max number of receive packets processed on single polling call" Drivers have different ways of listing their options and different means of implementing them. You can try these examples; however, if they fail, check the vendor Web site for example interface card and driver configurations. According to the header file e100.h, the driver option values are as follows: #define E100_AUTONEG 0 #define E100_SPEED_10_HALF 1 #define E100_SPEED_10_FULL 2 #define E100_SPEED_100_HALF 3 #define E100_SPEED_100_FULL 4 Therefore, when using insmod to install the driver or when modifying the modules.conf file, you add the following entry to configure the interface at 100 full duplex: # cat /etc/modules.conf ... options e100 e100_speed_duplex=4 ... Communication at the Physical LevelCommunication at the physical level is made possible by the physical address of the interface and the IP address assigned to it. The IP actually is assigned at a higher layer; however, we mention it here to assist with discussion of link-level communication. The association between the IP address and the Media Access Control (MAC) address is made possible by the Address Resolution Protocol (ARP). It is crucial to understand the interface, its MAC address, and the IP address assigned to it to troubleshoot this area. The question is whether Ethernet frames can traverse the network. The goal is to see whether this interface can see other interfaces. Before we begin discussing the particulars of troubleshooting, we need to discuss some items to provide a background for understanding some critical components. Included within the physical layer is Ethernet's Logical Link Control (LLC) and MAC protocol. In short, the LLC deals with error correction and flow control, whereas the MAC protocol encapsulates the network packet with the destination MAC address, source MAC address, and a cyclic redundancy check (CRC), creating the network frame. If the CRC values do not match, the frame is discarded, and communication between the source and destination might not be possible. The destination and source mentioned previously are self-explanatory; however, the CRC value is determined after performing a modulo-2 division of the data bits by a polynomial. The remainder of this division provides the CRC value. The importance of this is that after the frame reaches its destination, the Link layer of that interface performs the same algorithm and compares the results stored in this 4-byte address. As mentioned previously, the MAC address is a network interface's unique identifier. With Ethernet interfaces, vendors assign a unique address to each card. The IEEE assigns the vendor a unique ID, which is represented by the first 24 bits of the address (XX:XX:XX). Then the vendor must come up with the remaining unique 24 bits (YY:YY:YY). Each frame that traverses the TCP/IP network has this MAC header. The destination MAC is simply the next hop for the frame, which may or may not be the frame's final destination. If it is not the frame's final destination, the source MAC is set to the new interface's MAC address, and the destination MAC is set to the next hop. This setting, of course, does not affect the IP header and TCP headers stored within the frame because only the MAC addresses are manipulated. An example is a frame that must travel outside of its subnet, traveling through a router before arriving at its final destination. Higher layers, however, do not work with these MAC addresses and instead work with network addressesin our case, the IP addresses. When the transport layer sends a TCP packet down to the network layer, an IP header is added with the source and destination IP. However, for the IP packet to get to the destination, it must first determine its route, which is handled at the network layer. The route determines the interface from which the IP packet departs and the next interface that will receive the packet. We discuss routes in the next section; however, for the IP packet to reach its destination, the machine must be able to translate an IP to the physical interface address, which is where ARP and Reverse ARP play a role. ARP and RARP provide the link between the IP address of a card and its MAC address. In troubleshooting whether a machine can get to its gateway, checking the kernel's ARP cache can be of assistance. For example, if a machine cannot communicate on the network, a simple check of the ARP cache will determine whether any frames have been received from the gateway device. The following example illustrates this idea. First, confirm that the interface is up and has an IP assigned. # ifconfig eth1 eth1 Link encap:Ethernet HWaddr 00:06:25:AC:C5:25 inet addr:15.50.74.104 Bcast:15.50.74.255 Mask:255.255.255.0 UP BROADCAST RUNNING MULTICAST MTU:1500 Metric:1 RX packets:125 errors:0 dropped:0 overruns:0 frame:0 TX packets:65 errors:0 dropped:0 overruns:0 carrier:0 collisions:0 txqueuelen:100 RX bytes:18398 (17.9 Kb) TX bytes:9354 (9.1 Kb) Interrupt:3 Base address:0x100 Next, using the route command, we can determine that if any traffic from this machine needs to leave the local network, it must leave out device eth1 and go through a gateway of 15.50.74.40. # route Kernel IP routing table Destination Gateway Genmask Flags Metric Ref Use Iface 15.50.74.0 * 255.255.255.0 U 0 0 0 eth1 127.0.0.0 * 255.0.0.0 U 0 0 0 lo default 15.50.74.40 0.0.0.0 UG 0 0 0 eth1 Finally, we confirm that the kernel can populate the gateway's MAC address. This will confirm that communication to that interface is operational at this layer. # arp -v Address HWtype HWaddress Flags Mask Iface 15.50.74.40 ether 00:09:5B:24:65:3A C eth1 Entries: 1 Skipped: 0 Found: 1 This example confirms that the interface (eth1) has received an ARP reply from the gateway device. Note that the ARP entry is cached and will timeout. A quick ping can repopulate the ARP cache. Ethernet FramesIllustrated in Figures 13-1 through 13-4 are some Ethernet frames with the MAC encapsulation highlighted. There are essentially four types of Ethernet frames, which include Ethernet II (Figure 13-1), IEEE 802.3/802.2 (Figure 13-2), Novel 802.3 (Figure 13-3), and IEEE 802.3/802.2 SNAP (Figure 13-4). Note that we are using the TCP/IP protocol suite in our discussion, so these examples contain the MAC encapsulation. In addition, Ethernet frames have a maximum size, so bytes are taken from the payload to create room for the other protocols. Figure 13-1. A Novel 802.3 frame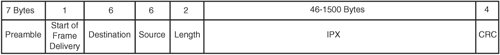 Figure 13-2. The Ethernet Sub Network Access Protocol (SNAP) frame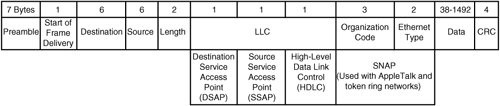 Figure 13-3. The Ethernet II frame. (Note that this example contains Type instead of Length. For example, IP is a protocol type.)Figure 13-4. An IEEE 802.3 with LLC Ethernet frame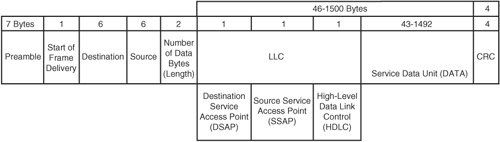 As Figure 13-5 shows, at each layer the data packet gets the new layer's header prepended to the frame. Figure 13-5. The new layer's header is prepended to the frame.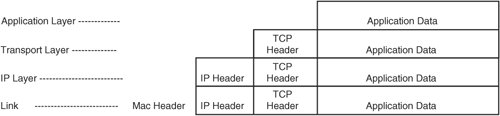 The main point of these figures is to show each layer's header as it is added to the packet. Each layer prepends its header to the preceding layer's packet, resulting in an Ethernet frame when it reaches the physical layer. Even though the details of the IP and transport layers are not included in the figures, the IP and TCP headers are present but are buried in the data portion of the frame. Internet sites are available that can determine the manufacturer of a network interface. As mentioned earlier, IEEE has set up rules that require every network adapter to have a unique identifier, and they supply the manufacturer with the first 24 bits. Given this, we can do a quick search on www.google.com and get a URL that can decode a MAC address to a vendor. The following is a list of MAC addresses used in this section of the book with the vendor that manufactures the interface.
Troubleshooting the Network Layer (OSI Third Layer, TCP/IP Second Layer)The internetwork layer is the point at which an IP header is added to the transport layer's datagram and routing of the network packet takes place; therefore, it is the next logical place to look for network problems in many cases. Both the OSI model and the TCP/IP model include this layer. This section starts with a brief overview of the protocols at this layer. It then takes a deeper look into the IP protocol before concluding with an overview of the IP address model and IP routing. The TCP/IP internetwork layer covers several protocols, namely the IP, ICMP, RIP, ARP, and RARP protocols. This section covers mainly the IP protocol because it is primarily used by the upper layers; however, we also touch on these other protocols because they sometimes are used in the troubleshooting arena. ARP and RARPAs mentioned in the previous layer's discussion, ARP enables mapping of an IP address to a station's physical address. Even though we have mentioned this in the previous layer, we mention it again here to clarify that the ARP and RARP functionality exists essentially between the physical and network layers of the TCP/IP model (or even the OSI model). Because communication between the interfaces only takes place at the link level, and because the higher layers only talk to the IP layer, the ARP and RARP protocols provide the necessary connection to make communication possible. It should be noted that the MAC addresses are encapsulated in the MAC header, which is applied to the datagram when it reaches the physical layer. To display a host's ARP cache, just use the arp command or cat /proc/net/arp, but bear in mind that the arp command has better formatted output. The following is an example of how the ARP cache is populated on a system. # arp -vn Address HWtype HWaddress Flags Mask Iface 15.50.74.40 ether 00:09:5B:24:65:3A C eth1 Entries: 1 Skipped: 0 Found: 1 # ping 15.50.74.20 Note that before the ping takes place, we must know where to send the Ethernet frame (link communication is done at the MAC level). This is where routing comes in; however, we cover routing later in this section. For now, let us just say that 15.50.74.20 is on the local network; therefore, an ARP broadcast will be sent out, and any device that knows the MAC of the IP being requested will respond with the information required. In this case, 15.50.74.40 is the local router/switch for this test network. Using a network troubleshooting tool such as ethereal and tracing the network ping request, we can see the ARP functionality taking place, as shown in the next listing. Note that we saved ethereal's output to /tmp/ping.trace. Review each frame of the trace: # cat /tmp/ping.trace The following shows the ARP broadcast in frame one. Frame 1 (42 bytes on wire, 42 bytes captured) Ethernet II, Src: 00:06:25:ac:c5:25, Dst: ff:ff:ff:ff:ff:ff Destination: ff:ff:ff:ff:ff:ff (Broadcast) Source: 00:06:25:ac:c5:25 (LinksysG_ac:c5:25) Type: ARP (0x0806) Address Resolution Protocol (request) Hardware type: Ethernet (0x0001) Protocol type: IP (0x0800) Hardware size: 6 Protocol size: 4 Opcode: request (0x0001) Sender MAC address: 00:06:25:ac:c5:25 (LinksysG_ac:c5:25) Sender IP address: 15.50.74.104 (15.50.74.104) Target MAC address: 00:00:00:00:00:00 (00:00:00_00:00:00) Target IP address: 15.50.74.20 (15.50.74.20) The following shows the ARP reply in frame two. Frame 2 (60 bytes on wire, 60 bytes captured) Ethernet II, Src: 00:0e:a6:78:e3:d6, Dst: 00:06:25:ac:c5:25 Destination: 00:06:25:ac:c5:25 (LinksysG_ac:c5:25) Source: 00:0e:a6:78:e3:d6 (00:0e:a6:78:e3:d6) Type: ARP (0x0806) Trailer: 00000000000000000000000000000000... Address Resolution Protocol (reply) Hardware type: Ethernet (0x0001) Protocol type: IP (0x0800) Hardware size: 6 Protocol size: 4 Opcode: reply (0x0002) Sender MAC address: 00:0e:a6:78:e3:d6 (00:0e:a6:78:e3:d6) Sender IP address: 15.50.74.20 (15.50.74.20) Target MAC address: 00:06:25:ac:c5:25 (LinksysG_ac:c5:25) Target IP address: 15.50.74.104 (15.50.74.104)Check the host's ARP cache to make sure that the host's MAC shows up, as per the following. # arp -vn Address HWtype HWaddress Flags Mask Iface 15.50.74.20 ether 00:0E:A6:78:E3:D6 C eth1 15.50.74.40 ether 00:09:5B:24:65:3A C eth1 Entries: 2 Skipped: 0 Found: 2 To clarify, if this destination IP were not on the same subnet (discussed later), the MAC of the destination IP would not be in our host's ARP cache. The cache only includes devices on the same physical network. If the IP were on another network, the ARP cache would be populated with the MAC of the gateway device required to leave this network to get to the destination IP. In the previous example, the gateway (15.50.74.40) would be the hop required to get to any other network. ICMPOne of the most recognized protocols other than IP is the Internet Control Message Protocol (ICMP), mainly because everyone's first method of troubleshooting a network problem is to ask whether they can ping the desired destination. After the cables are run and the IP addresses are assigned, the first thing usually done is a ping test. This is nothing more than an application that uses ICMP, which is located at this layer. ping builds ICMP control messages and sends them out over the wire, awaiting a reply from the destination machine. The replies provide some very useful information, including the time it took to receive the reply message and whether any packets are being dropped. Note that in today's IT world, most companies disable ICMP messages from coming into their environments from the Internet to prevent unwanted or malicious communications. Continuing with the previous ARP cache example, we can see the ICMP messages with frames three and beyond. Frame 3 (ICMP) Frame 3 (98 bytes on wire, 98 bytes captured) Ethernet II, Src: 00:06:25:ac:c5:25, Dst: 00:0e:a6:78:e3:d6 Destination: 00:0e:a6:78:e3:d6 (00:0e:a6:78:e3:d6) Source: 00:06:25:ac:c5:25 (LinksysG_ac:c5:25) Type: IP (0x0800) Internet Protocol, Src Addr: 15.50.74.104 (15.50.74.104), Dst Addr: 15.50.74.20 (15.50.74.20) Version: 4 Header length: 20 bytes Differentiated Services Field: 0x00 (DSCP 0x00: Default; ECN: 0x00) Total Length: 84 Identification: 0x0000 (0) Flags: 0x04 Fragment offset: 0 Time to live: 64 Protocol: ICMP (0x01) Header checksum: 0x87c9 (correct) Source: 15.50.74.104 (15.50.74.104) Destination: 15.50.74.20 (15.50.74.20) Internet Control Message Protocol Type: 8 (Echo (ping) request) Code: 0 Checksum: 0x8dd8 (correct) Identifier: 0x9a0a Sequence number: 0x0001 Data (56 bytes) The reply to ping was in the very next frame received on that interface! Frame 4 (98 bytes on wire, 98 bytes captured) Ethernet II, Src: 00:0e:a6:78:e3:d6, Dst: 00:06:25:ac:c5:25 Destination: 00:06:25:ac:c5:25 (LinksysG_ac:c5:25) Source: 00:0e:a6:78:e3:d6 (00:0e:a6:78:e3:d6) Type: IP (0x0800) Internet Protocol, Src Addr: 15.50.74.20 (15.50.74.20), Dst Addr: 15.50.74.104 (15.50.74.104) Version: 4 Header length: 20 bytes Differentiated Services Field: 0x00 (DSCP 0x00: Default; ECN: 0x00) Total Length: 84 Identification: 0x8045 (32837) Flags: 0x00 Fragment offset: 0 Time to live: 64 Protocol: ICMP (0x01) Header checksum: 0x4784 (correct) Source: 15.50.74.20 (15.50.74.20) Destination: 15.50.74.104 (15.50.74.104) Internet Control Message Protocol Type: 0 (Echo (ping) reply) Code: 0 Checksum: 0x95d8 (correct) Identifier: 0x9a0a Sequence number: 0x0001 Data (56 bytes) In the following example, we show a ping test that fails. We use hp.com as the test site, knowing that a ping test probably will fail due to ICMP datagrams' being ignored. # ping hp.com PING hp.com (161.114.22.105) 56(84) bytes of data. --- hp.com ping statistics --- 9 packets transmitted, 0 received, 100% packet loss, time 8017ms In this case, knowing that a ping test failed does not mean that the hp.com site is down; it just means that it does not respond to ICMP requests. The following is a portion of the network trace of the ping test to hp.com using ethereal. Frame 4 (98 bytes on wire, 98 bytes captured) Ethernet II, Src: 00:06:25:ac:c5:25, Dst: 00:09:5b:24:65:3a Destination: 00:09:5b:24:65:3a (Netgear_24:65:3a) Source: 00:06:25:ac:c5:25 (LinksysG_ac:c5:25) Type: IP (0x0800) Internet Protocol, Src Addr: 15.50.74.104 (15.50.74.104), Dst Addr: 161.114.22.105 (161.114.22.105) Version: 4 Header length: 20 bytes Differentiated Services Field: 0x00 (DSCP 0x00: Default; ECN: 0x00) Total Length: 84 Identification: 0x0000 (0) Flags: 0x04 .1.. = Don't fragment: Set ..0. = More fragments: Not set Fragment offset: 0 Time to live: 64 Protocol: ICMP (0x01) Header checksum: 0x2934 (correct) Source: 15.50.74.104 (15.50.74.104) Destination: 161.114.22.105 (161.114.22.105) Internet Control Message Protocol Type: 8 (Echo (ping) request) Code: 0 Checksum: 0x2d82 (correct) Identifier: 0x7620 Sequence number: 0x0001 Data (56 bytes) Unlike the successful ping in the previous example, in this case no reply ping completes the ICMP sequence. The following is an example of how to configure a Linux machine to ignore ICMP requests. # ping localhost PING localhost (127.0.0.1) 56(84) bytes of data. 64 bytes from localhost (127.0.0.1): icmp_seq=1 ttl=64 time=0.102 ms --- localhost ping statistics --- 1 packets transmitted, 1 received, 0% packet loss, time 0ms rtt min/avg/max/mdev = 0.102/0.102/0.102/0.000 ms Next you disable ICMP: # echo 1 > /proc/sys/net/ipv4/icmp_echo_ignore_all Repeating the same test as previously, we get the following: # ping localhost PING localhost (127.0.0.1) 56(84) bytes of data. --- localhost ping statistics --- 2 packets transmitted, 0 received, 100% packet loss, time 1013ms IPBy far, IP is the most recognized protocol used in this layer. It is even a portion of the name of the protocol suite upon which this chapter focuses: TCP/IP. The Internet Protocol provides, among other things, a logical addressing of the physical interfaces and routing of the data throughout the network. IP addresses are divided into networks and then into subnetworks, which assists in decreasing network congestion and reducing collision rates. In this section, we begin with an anatomy of the IP header, which, just like the MAC header, is prepended to the transport layer's datagram. Figure 13-6 provides an illustration of the IP header. Figure 13-6. The IP header broken down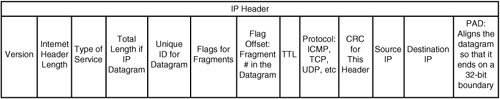 The IP header does have a few interesting areas that we should mention before proceeding. For example, the IP version identifies whether the packet is meant for the standard IPv4 (32-bit) network or the newer IPv6 (128-bit) network. In today's IT environments, most network configurations use the IPv4 protocol version; however, use of IPv6 is growing. The newer IPv6 (128-bit IP) protocol essentially eliminates many of the shortcomings of IPv4, the largest of which is the lack of available addresses. IPv6 also does away with ARP and replaces it with multicast neighbor solicitation messages. Because the majority of users are still connected to IPv4 installations, however, this book only covers troubleshooting with the IPv4 protocol. Other fields of interest are the Type of Service (TOS), Flags, Fragment offset, Time-To-Live (TTL), Protocol, and the source and destination IP. The 8-bit TOS field refers to the precedence, delay, normal throughput, and normal reliability of the IP datagram. The TOS is a legacy term, which has now been replaced with "differentiated services," which is the new approach for IP Quality of Service (QoS). Upon reviewing an ethereal output of an IP frame, we would see the TOS field as the Differentiated Services Code Point (DSCP), as shown here. # cat /tmp/ethereal.trace ... Differentiated Services Field: 0x10 (DSCP 0x04: Unknown DSCP; ECN: 0x00) 0001 00.. = Differentiated Services Codepoint: Unknown (0x04) .... ..0. = ECN-Capable Transport (ECT): 0 .... ...0 = ECN-CE: 0 ... Another place that documents the QoS for a packet is located in the man page on ping. See the -Q option, as in the following. ... -Q tos Set Quality of Service -related bits in ICMP datagrams. tos can be either decimal or hex number. Traditionally (RFC1349), these have been interpreted as: 0 for reserved (currently being redefined as congestion control), 1-4 for Type of Service and 5-7 for Precedence. Possible settings for Type of Service are: minimal cost: 0x02, reliability: 0x04, throughput: 0x08, low delay: 0x10. Multiple TOS bits should not be set simultaneously. Possible settings for special Precedence range from priority (0x20) to net control (0xe0). You must be root CAP_NET_ADMIN capability) to use Critical or higher precedence value. You cannot set bit 0x01 (reserved) unless ECN has been enabled in the kernel. In RFC2474, these fields has been redefined as 8-bit Differentiated Services (DS), consisting of: bits 0-1 of separate data (ECN will be used, here), and bits 2-7 of Differentiated Services Codepoint (DSCP). ... The FLAG and Fragment offset fields deal with datagram fragmentation. As covered earlier, IP datagrams are encapsulated into Ethernet frames, which have a Maximum Transaction Unit (MTU). Just as the link layer has its MTU, the IP layer has its maximum length. If an IP datagram exceeds this maximum, then the packet is fragmented. Unlike IPv6, in which only the host can fragment a packet, in IPv4, the packet can be fragmented at the host or any intermediate routers. The 3-bit flag field indicates whether the packet is fragmented, and the 64-bit fragmentation offset field indicates the fragment location so that the receiving host can put the fragments back together and rebuild the datagram. If a fragment is lost in the transmission, the entire datagram is discarded after a timeout, and the datagram must be re-sent. Next is an example of a fragmented ICMP ping request. # ping -s 1472 15.50.74.20 (This allows the packet to align on the MTU size) PING 15.50.74.20 (15.50.74.20) 1472(1500) bytes of data. 1480 bytes from 15.50.74.20: icmp_seq=1 ttl=64 time=3.93 ms 1480 bytes from 15.50.74.20: icmp_seq=2 ttl=64 time=3.44 ms 1480 bytes from 15.50.74.20: icmp_seq=3 ttl=64 time=3.22 ms The following is just a fragment of the datagram: Frame 2 (586 bytes on wire, 586 bytes captured) Ethernet II, Src: 00:06:25:ac:c5:25, Dst: 00:0e:a6:78:e3:d6 Internet Protocol, Src Addr: 15.50.74.104 (15.50.74.104), Dst Addr: 15.50.74.20 (15.50.74.20) Version: 4 Header length: 20 bytes Differentiated Services Field: 0x00 (DSCP 0x00: Default; ECN: 0x00) Total Length: 572 Identification: 0x0000 (0) Flags: 0x06 .1.. = Don't fragment: Set ..1. = More fragments: Set Fragment offset: 552 Time to live: 64 Protocol: ICMP (0x01) Header checksum: 0x659c (correct) Source: 15.50.74.104 (15.50.74.104) Destination: 15.50.74.20 (15.50.74.20) Data (552 bytes) The last packet that completes this transfer segment is shown next: Frame 3 (410 bytes on wire, 410 bytes captured) Ethernet II, Src: 00:06:25:ac:c5:25, Dst: 00:0e:a6:78:e3:d6 Internet Protocol, Src Addr: 15.50.74.104 (15.50.74.104), Dst Addr: 15.50.74.20 (15.50.74.20) Version: 4 Header length: 20 bytes Differentiated Services Field: 0x00 (DSCP 0x00: Default; ECN: 0x00) Total Length: 396 Identification: 0x0000 (0) Flags: 0x04 .1.. = Don't fragment: Set ..0. = More fragments: Not set Fragment offset: 1104 Time to live: 64 Protocol: ICMP (0x01) Header checksum: 0x8607 (correct) Source: 15.50.74.104 (15.50.74.104) Destination: 15.50.74.20 (15.50.74.20) Data (376 bytes) The next two fields deal with the duration for which the packet survives on the network before being discarded and the protocol that follows the IP header. The Time-To-Live (TTL) is either measured in hops or seconds depending on the OS and device. The most common protocols for our discussion are TCP, UDP, ICMP, and even Encapsulating Security Payload (ESP for VPN tunnels). Before we cover the IP address model, we should mention a few Linux kernel parameters, which are listed here. # ls /proc/sys/net/ipv4/ip* /proc/sys/net/ipv4/ip_autoconfig /proc/sys/net/ipv4/ip_default_ttl /proc/sys/net/ipv4/ip_dynaddr /proc/sys/net/ipv4/ip_forward /proc/sys/net/ipv4/ipfrag_high_thresh /proc/sys/net/ipv4/ipfrag_low_thresh /proc/sys/net/ipv4/ipfrag_time /proc/sys/net/ipv4/ip_local_port_range /proc/sys/net/ipv4/ip_nonlocal_bind /proc/sys/net/ipv4/ip_no_pmtu_disc A brief description of some of the kernel parameters follows.
Note that if your system is on a network with a high number of fragmented packets, it will suffer a performance hit as a result of managing the overhead of rebuilding the packets into the originating datagram. Furthermore, your system runs the risk of reaching the timeout before receiving all the fragments, in which case the datagram's must be re-sent. IP: Address Model and RoutingThe next logical step in the ideal network troubleshooting process is determining why a host is having difficulty in communicating with another host. You need the applicable IP address(es), subnet mask, and gateway to troubleshoot at this point. Just as each physical network interface has an address given to it by its manufacturer, for a card to be used on the network, the system administrator or network engineer must assign the interface a logical address. Recall that we focus on the address model of IPv4 here. First, by way of background, let us quickly cover the IP layout. IPs are composed of two sides: one network and one host. The network side routes IP packets from one network to another, whereas the host side directs packets to the appropriate network interfaces. When originally developed, IPs were assigned classes, which defined particular network ranges by defining the default network mask. The network mask positions the separator (separation between the network and host portions) for the IP's two parts, assigning n number of bits to the network side and the remaining H number of bits to the host side. These bits are used to calculate the number of networks in an IP range and the number of hosts on each of those networks. If two IPs that are attempting to communicate with each other reside on the same network, packet routing is not required. If routing is not required, yet there remains a problem with IP communication, we know the problem is either an issue previously discussed at the hardware link layer (ARP or lower) or an issue with firewall implementation (discussed later in this chapter). If routing is involved, this is where the gateway IP plays a crucial role because it is the one device tasked with getting the packet to its destination network. To briefly cover network routing, we begin by providing some background on network classes and their roles. As previously mentioned, the IP has two parts. The network portion is then subcategorized into classes. The first few bits, which form the network portion of the address, distinguish the five network classes. These classes, which originally were designed by the U.S. Department of Defense, range from A to E. Of these five classes, primarily the first three are used. The fourth class, D, is used only as a multicast network range. A multicast network is not common; however, it does provide the capability for a single IP to be assigned to multiple hosts, which in turn enables multiple hosts to receive the same broadcast from a single transmission. The fifth and final class, E, is reserved for future use. In any case, the network class determines the default mask, and as a result, it also determines the ratio of hosts to networks that we can use. The determination of the IP class falls on which of the first few Big Endian bits are set. Note that the TCP/IP stack is defined in Big Endian order, meaning that the most significant value is stored at the lowest address. An IP address is made up of four integer fields separated by dots (for example, 15.38.28.2). Each field is composed of eight bits, which collectively are referred to as an "octet." Because there are four octets, the sum yields the 32 total bits that make up an IPv4 address. The following is an IP address and the same address in bit form:
Figure 13-7 is an illustration of how the first octet (123) is calculated. Figure 13-7. Calculation of the first octet A bit is either on (1) or off (0). Sum the on bits as follows: 64+32+16+8+2+1 = 123. As mentioned earlier, the first octet also determines the IP class. Table 13-2 illustrates how the class is determined. Take note of the bold bits.
There are default masks for each class of network; however, subnet masks can be modified to create smaller or larger groupings of hosts/networks. Since the mid '90s, the routing protocols have used an "IP network prefix" called Classless Inter-Domain Routing (CIDR) mentioned previously. In either case, the calculation is done in the same manner; however, with CIDR, the mask is no longer restricted to the boundaries set by the IP class. With CIDR, the network prefix is the number of contiguous bits set to "1," which identifies the network. Originally implemented due to the routing overhead caused by the Class C network range, it is now found in many network installations. First, we show an illustration of how a subnet mask is used to calculate the network range, and then we proceed to show the default masks and networks/hosts available for each. The following is an example of a network calculation using the same IP from earlier (IP = 123.2.3.4). The class is A, so the default subnet is 255.0.0.0. The bit notation of the IP and the mask are as follows: IP: 01111011.00000010.00000011.00000100 Mask: 11111111.00000000.00000000.00000000 Note that the separation between the network portion and the host portion of the IP is on the octet boundary. So, in this case, the "separator" between the network side and the host side is the decimal between the contiguous 1s and 0s. Performing a logical AND calculation yields the logical network. The calculation goes like this: (0 AND 1 = 0), (0 AND 0 = 0), (1 AND 0 = 0), (1 AND 1 = 1) AND: 01111011.00000000.00000000.00000000 Converting the AND results into IP form yields the IP network:
The "host" IP range is all possible variations of bit settings between all zeros and all ones in the host portion of the address.
Illustrated next are the primary class layouts in detail:
As aforementioned, in network troubleshooting, we need the applicable IP address(es), subnet mask, and the gateway. Determining the logical network in which an IP resides requires a basic understanding of IP classes and network masks. As shown previously, originally the class defined the subnet mask, so it also defined the network. Note that today, however, this is not necessarily the case as with the introduction of CIDR in the mid '90s. The CIDR is represented by a value and the end of an IP address in the form of IP/#, where # is the number of network bits in the netmask. Let us review an example of CIDR in action. Look at the following IP address:
Here we have a Class A address; however, instead of the network mask being 8 bits in length, it is set to 21 (essentially a Class C netmask of 255.255.248.0). Using the same method as before, we can calculate the network by taking the IP and logically ANDing the mask to it. Again, we use "|" to show where the mask separates the net from the host portion. IP: 15.50.65.104 00001111.00110010.01000 | 001.01101000 Mask: 255.255.248.0 11111111.11111111.11111 | 000.00000000 The logical AND yields Net: 15.50.64.0 00001111.00110010.01000 | 000.00000000 Setting all the host bits to 1 yields the broadcast for the network. Broadcast: 15.50.71.255 00001111.00110010.01000 | 111.11111111 As shown previously, normally a Class A network has millions of hosts and few networks, whereas a Class C network has the opposite. To reduce network congestion, a network engineer can use this type of layout to increase the number of networks contained within a Class A network. Because the class no longer defines the number of networks, we call this "classless inter-domain routing," as mentioned earlier. This calculation can be depicted easily using any number of tools that are packaged with some Linux distributions and other tools simply downloaded off the Internet. An example of such a tool from the Internet is a Perl script called ipcalc (by Krischan Jodies GPL) from http://jodies.de/ipcalc (downloaded latest rev .38 05/2005). We like using this tool because it shows the important IPs needed for an IP/mask range while also including the bit notation so that you can see how the calculation was done. The following is the same IP/CIDR from earlier, passed as an argument to the ipcalc program. # ipcalc 15.50.65.104/21 Address: 15.50.65.104 00001111.00110010.01000 001.01101000 Netmask: 255.255.248.0 = 21 11111111.11111111.11111 000.00000000 Wildcard: 0.0.7.255 00000000.00000000.00000 111.11111111 => Network: 15.50.64.0/21 00001111.00110010.01000 000.00000000 HostMin: 15.50.64.1 00001111.00110010.01000 000.00000001 HostMax: 15.50.71.254 00001111.00110010.01000 111.11111110 Broadcast: 15.50.71.255 00001111.00110010.01000 111.11111111 Hosts/Net: 2046 Class A As shown previously, the calculation for the number of hosts/net is 2^hostbits 2. In this case, the number is 2^11 2 = 2046 hosts/net. Note that a host cannot be assigned an IP address that has the host bits set to all 0s or all 1s. As shown previously, when all the host bits are set to zero, this defines the network. So the first host IP in this case is 123.0.0.1. In the same manner, not all the host bits can be set to 1. When all the host bits are set to 1, this represents a special IP known as the broadcast IP for the network. Each network range, by this definition, has a broadcast, which is always the highest possible IP for the network range. So, the highest usable host IP must be the broadcast minus one, or in this case, 123.255.255.254. Thus, for any IP range, we have to subtract 2 IPs from the range because they cannot be used. The broadcast IP is unique in that it can help troubleshoot why a host cannot communicate with a desired interface on the same network. When a host sends a packet with the destination of the network ranges broadcasted, the lower MAC header's destination is set to ff:ff:ff:ff:ff:ff. Thus, after the IP packet is built and passed down to the lower link layer, the packet is not intended for one interface but rather all interfaces on the network. So, for example you could determine whether the troublesome interface can see any interface on the local network by sending a simple ping to the broadcast IP. The key here is that this technique is used to troubleshoot a local network because a broadcast IP transmission is not routed, but they are used to populate routing tables. Generally, router devices or hosts are located at either the lowest or highest IP address of the network, depending on how the network is designed. Usually, however, the same scheme is used throughout a single network design. For an IP packet to leave a network, it must go through a router. The router is the device that knows how to get to subsequent networks or that knows of another device that can get to another network. Note that going from one network to another by way of routing a packet is considered a "hop." Though exceptions exist, even among large networks, such as the World Wide Web, getting to the destination IP generally involves no more than fifteen or sixteen hops. Scenario 13-1: Unable to Communicate with Other HostsAfter connecting a network cable to an interface and confirming that the link is online, we cannot communicate with other hosts. What do we do? The hosts are at the following IP addresses: Host A is at 15.50.64.104 Linux Host B is at 15.50.65.103 HP-UX Begin by determining the IP and network mask assigned to each interface. For Host A, ifconfig yields the following: # ifconfig eth1 eth1 Link encap:Ethernet HWaddr 00:30:6E:F4:26:EC inet addr:15.50.65.104 Bcast:15.50.1.1 Mask:255.255.248.0 inet6 addr: fe80::230:6eff:fef4:26ec/64 Scope:Link UP BROADCAST RUNNING MULTICAST MTU:1500 Metric:1 RX packets:461962 errors:2 dropped:0 overruns:0 frame:0 TX packets:3447 errors:0 dropped:0 overruns:0 carrier:0 collisions:0 txqueuelen:1000 RX bytes:45269857 (43.1 Mb) TX bytes:278694 (272.1 Kb) Interrupt:85 For Host B, ifconfig yields the following: # ifconfig lan0 lan0: flags=843<UP,BROADCAST,RUNNING,MULTICAST> inet 15.228.74.55 netmask fffffe00 broadcast 15.228.75.255 A netmask of fffffe00 = 255.255.254.0. As shown, the crucial pieces of information include the IP address and the network mask. From these two pieces of information, the IP layer of the kernel calculates the broadcast. Of course, all these values can be specified by the administrator, so when troubleshooting the network, double-check these values. The broadcast should be the highest IP in a network range, which most of the time would have a "255" somewhere. Host A's interface, however, does not show the broadcast we would expect. SUSE Linux has its network configuration files under /etc/sysconfig/network/, and the files usually have the interface's MAC located in the filename, such as ifcfg-eth-id-00:30:6e:f4:26:ec. Other distributions follow similar practices: Mandrake and Red Hat place the file in /etc/sysconfig/network-scripts/ and name it ifcfg-eth0, and so forth. Next, ping the broadcast to see whether there are any other IPs on the local network. For Host A, ping yields the following: # ping -b 15.50.1.1 WARNING: pinging broadcast address PING 15.50.1.1 (15.50.1.1) 56(84) bytes of data. 64 bytes from 15.50.65.104: icmp_seq=1 ttl=64 time=0.044 ms 64 bytes from 15.50.65.104: icmp_seq=2 ttl=64 time=0.007 ms 64 bytes from 15.50.65.104: icmp_seq=3 ttl=64 time=0.005 ms 64 bytes from 15.50.65.104: icmp_seq=4 ttl=64 time=0.006 ms Right away, we can tell that something is wrong, unless this is the only interface on the local network. Check the host's ARP cache for entries. # arp -n # Nothing? Using the ipcalc tool, we quickly can confirm the IP ranges and broadcast. # ipcalc 15.50.65.104/255.255.248.0 Address: 15.50.65.104 00001111.00110010.01000 001.01101000 Netmask: 255.255.248.0 = 21 11111111.11111111.11111 000.00000000 Wildcard: 0.0.7.255 00000000.00000000.00000 111.11111111 => Network: 15.50.64.0/21 00001111.00110010.01000 000.00000000 HostMin: 15.50.64.1 00001111.00110010.01000 000.00000001 HostMax: 15.50.71.254 00001111.00110010.01000 111.11111110 Broadcast: 15.50.71.255 00001111.00110010.01000 111.11111111 Hosts/Net: 2046 Class A So, the broadcast is wrong? Yet the kernel should have calculated the right broadcast IP. Thus, it sounds like a configuration file mistake. # cat /etc/sysconfig/network/ifcfg-eth-id-00:30:6e:f4:26:ec BOOTPROTO='static' BROADCAST='15.50.1.1' IPADDR='15.50.65.104' MTU='' NETMASK='255.255.248.0' NETWORK='15.50.64.0' REMOTE_IPADDR='' STARTMODE='onboot' UNIQUE='3pA6.sg1D61MCQsA' _nm_name='bus-pci-0000:be:01.0' ETHTOOL_OPTS="speed 100 duplex full"Not all network problems are identified so easily, yet the background should prove helpful. After blanking the broadcast line in the config file and reinitializing the interface, we test the ping again. # ifdown eth1 # ifup eth1 # ifconfig eth1 eth1 Link encap:Ethernet HWaddr 00:30:6E:F4:26:EC inet addr:15.50.65.104 Bcast:15.50.71.255 Mask:255.255.248.0 inet6 addr: fe80::230:6eff:fef4:26ec/64 Scope:Link UP BROADCAST RUNNING MULTICAST MTU:1500 Metric:1 RX packets:22 errors:0 dropped:0 overruns:0 frame:0 TX packets:6 errors:0 dropped:0 overruns:0 carrier:0 collisions:0 txqueuelen:1000 RX bytes:1673 (1.6 Kb) TX bytes:484 (484.0 b) Now that the broadcast is correct, let us retry pinging the broadcast. # ping -b 15.50.71.255 WARNING: pinging broadcast address PING 15.50.71.255 (15.50.71.255) 56(84) bytes of data. 64 bytes from 15.50.65.104: icmp_seq=1 ttl=64 time=0.046 ms 64 bytes from 15.50.65.214: icmp_seq=1 ttl=255 time=0.381 ms (DUP!) 64 bytes from 15.50.64.217: icmp_seq=1 ttl=255 time=0.412 ms (DUP!) 64 bytes from 15.50.64.216: icmp_seq=1 ttl=255 time=0.498 ms (DUP!) 64 bytes from 15.50.65.102: icmp_seq=1 ttl=64 time=0.657 ms (DUP!) 64 bytes from 15.50.65.35: icmp_seq=1 ttl=255 time=1.01 ms (DUP!) 64 bytes from 15.50.65.106: icmp_seq=1 ttl=64 time=1.12 ms (DUP!) 64 bytes from 15.50.64.209: icmp_seq=1 ttl=255 time=1.95 ms (DUP!) 64 bytes from 15.50.64.108: icmp_seq=1 ttl=64 time=9.10 ms (DUP!) 64 bytes from 15.50.65.6: icmp_seq=1 ttl=255 time=9.21 ms (DUP!) ... It works. The DUP normally is a bad sign because it means duplicate or damaged packets are being received. This is to be expected when sending a ping to the broadcast. Under normal conditions, ping sends out one packet and expects a single reply to that packet (as opposed to multiple replies); however, when sending a ping to a broadcast, we get a reply from everyone on the local network. Notice that when we can ping the broadcast, we get an ARP entry for every IP in our local network. # arp -n Address HWtype HWaddress Flags Mask Iface 15.50.64.19 ether 00:30:6E:0C:80:F9 C eth1 15.50.64.18 ether 00:30:6E:0C:81:2C C eth1 15.50.64.48 ether 08:00:09:8E:0C:E2 C eth1 15.50.64.108 ether 00:10:83:49:48:80 C eth1 15.50.64.109 ether 00:10:83:C3:AF:80 C eth1 15.50.65.180 ether 00:10:83:F7:02:15 C eth1 15.50.64.216 ether 00:10:83:36:84:D3 C eth1 15.50.64.217 ether 00:0F:20:1D:8E:44 C eth1 15.50.64.104 ether 00:01:E7:33:AB:00 C eth1 After confirming that communication on the local network is up and operational, the user still cannot communicate from Host A to Host B or vice versa. Recall that the Linux kernel has the capability to ignore ICMP packets. It can also just ignore ICMP packets with a destination of broadcast. This is accomplished when the kernel file /proc/sys/net/ipv4/icmp_echo_ignore_broadcasts contains a value of 1. Even a network trace would not help here because the kernel does not reject the packet that would create a reply; the packet simply is dropped. In the example, the two hosts are on different networks, so for the communication to take place, a router must be involved. Host A is on a network of 15.50.64.0/21, and Host B is on a network of 15.228.74.0/23. For host communication to take place, we must determine whether the routes are set up. As mentioned before, the router must be on the local network because the only thing to which the host can route is on the local network range. If a packet is to leave a network, the router uses its route tables to determine the best path. Determine route setup on Host A. (Assume the network administrator said that the router for the network is at 15.50.64.1.) There are several ways to gather routing information on a Linux host, including commands such as netstat and route, as well as issuing a cat /proc/net/route. (Note that the output of the cat command reports the entries in HEX as well as Little Endian order, so a destination of 15.50.64.0 would be 0x0F324000 in Big Endian and 0x0040320f in Little Endian.) # netstat -rn Kernel IP routing table Destination Gateway Genmask Flags MSS Window irtt Iface 15.50.64.0 0.0.0.0 255.255.248.0 U 0 0 0 eth1 127.0.0.0 0.0.0.0 255.0.0.0 U 0 0 0 lo Determine whether the router can be pinged. # ping 15.50.64.1 PING 15.50.64.1 (15.50.64.1) 56(84) bytes of data. 64 bytes from 15.50.64.1: icmp_seq=1 ttl=255 time=0.271 ms 64 bytes from 15.50.64.1: icmp_seq=2 ttl=255 time=0.281 ms --- 15.50.64.1 ping statistics --- 2 packets transmitted, 2 received, 0% packet loss, time 999ms rtt min/avg/max/mdev = 0.271/0.276/0.281/0.005 ms Yes, so add the route to the machine. # route add default gw 15.50.64.1 eth1 # route -n Kernel IP routing table Destination Gateway Genmask Flags Metric Ref Use Iface 15.50.64.0 0.0.0.0 255.255.248.0 U 0 0 0 eth1 127.0.0.0 0.0.0.0 255.0.0.0 U 0 0 0 lo 0.0.0.0 15.50.64.1 0.0.0.0 UG 0 0 0 eth1 Now that the route entry has been added and we have confirmed that the interface can communicate on the local network, we see whether it can ping Host B. # ping 15.228.74.55 PING 15.228.74.55 (15.228.74.55) 56(84) bytes of data. --- 15.228.74.55 ping statistics --- 2 packets transmitted, 0 received, 100% packet loss, time 999ms IP is a two-way street. Not only must the IP configuration be correct on the local host, but it also must be right on the destination host. In this case, we start by checking whether the destination host has a route entry. # netstat -rn Routing tables Destination Gateway Flags Refs Interface Pmtu 127.0.0.1 127.0.0.1 UH 0 lo0 4136 15.228.74.55 15.228.74.55 UH 0 lan0 4136 15.228.74.0 15.228.74.55 U 2 lan0 1500 127.0.0.0 127.0.0.1 U 0 lo0 0 Here we see that Host B does not have a network route entry to leave the local network. We could do a network trace to see whether the packet was reaching the host, but the host would not know how to respond. After adding the default route entry for the network, we get a successful ping. # route add default 15.228.74.1 1 <-- HPUX requires # of HOPS which in this case is 1. add net default: gateway 15.228.74.1 On Host A attempt to ping Host B # ping 15.228.74.55 PING 15.228.74.55 (15.228.74.55) 56(84) bytes of data. 64 bytes from 15.228.74.55: icmp_seq=1 ttl=254 time=1.22 ms 64 bytes from 15.228.74.55: icmp_seq=2 ttl=254 time=0.184 ms --- 15.228.74.55 ping statistics --- 2 packets transmitted, 2 received, 0% packet loss, time 1000ms rtt min/avg/max/mdev = 0.184/0.704/1.224/0.520 ms In conclusion, when troubleshooting at the IP layer, confirm that the hosts either are on the same IP network or possess a gateway/router that is configured to enable communication between the two hosts, as in the previous example. Network routing protocols extend beyond the context of this book; however, we mention the subject briefly here. In troubleshooting a network, a system administrator can trace a network interface with tcpdump or ethereal and discover protocols such as Routing Information Protocol (RIP) or Open Shortest Path First (OSPF). These are used by routers and other hosts posing as routers by running gated or routed. Gateways perform dynamic route discovery by using RIP. They send RIP queries down the broadcast of a given network. These queries return the information needed to build routing tables, so when a host needs to leave a given network for another one, the gateway device knows the route to take. Routers not only build their own route databases for their own networks, but they also receive routing databases from other routers, so eventually all the routers/gateways on the network will have route tables that can route network traffic throughout their networks while attempting to keep the number of network hops to a minimum. Many documents and books explain the intricacies of network routing. IP Firewalls: iptablesBefore progressing to the next logical layer (transport), note that the Linux kernel has a built-in packet-filtering firewall mechanism that operates at the IP, MAC, and transport layers. If, after confirming that the IP address and routing, are not problems, along with all the hardware in the middle (switches, routers, gateways, and so on), consider the possibility that the problem is being caused by the Linux firewall or, for that matter, another firewall. Some Linux distributions have a firewall scheme in place by default. That firewall scheme disables significant amounts of network communication. For network security, this is a good thing; however, for the person needing to log in to the machine remotely, this can be, to say the least, "a sore point." iptables and the older version called ipchains are implemented through a firewall script. Today's Linux kernels 2.4 and higher use iptables. Note that some initial 2.4 kernel releases used ipchains. Many books and sources on the Web describe how to set up an iptables firewall. There are even example scripts, including the scripts that are shipped with some Linux distributions. Of course, this subject is beyond the scope of this book. However, we do offer some information for background purposes only. iptables operates with three chains: INPUT, OUTPUT, and FORWARD. With these chains, the administrator can set the rule for the chain ACCEPT, DENY, and DROP. It is possible to lock down the machine so tightly that not only can packets not get into the machine, but they also cannot leave the machine. If, after troubleshooting a connection, you cannot connect, you might try disabling the firewall and seeing whether the connection is still broken. In a high-security environment, this is not recommended, of course, but it is a fast way to rule it out. In the next section, we demonstrate the TCP and UDP protocols. If you are dealing with a UDP protocol, the firewall could present a major problem. Because the protocol is connectionless, there is no acknowledgment of the datagram; therefore, unless the program had an embedded timeout, such as an alarm(), it would not know whether the packet got to its destination. On the other hand, a network trace would show the packet inbound. In addition, the iptables firewall has the capability to log connection attempts such as an inbound UDP datagram. If the iptables policy is set to DROP and NOLOG, then the trace is the way to go. If, however, the policy is DENY, the host making the connection request sees an ICMP-3 message returned in a local trace. However, most firewalls do not DENY because that would generate a reply and acknowledge the machine's existence on the network. You can identify programs attempting to connect to remote machines by utilizing the netstat command. For TCP connections, netstat might show SYN_SENT, indicating that a TCP connection is trying to become established, but if the firewall has a policy to DROP inbound connections on the destination port, the program must timeout. However, because UDP datagrams are connectionless, the only thing to do is review UDP stats with netstat. Tools that can determine whether a firewall is in place include these:
Here is an example of nmap in action: # nmap -sS -P0 15.50.65.104 Starting nmap 3.70 ( http://www.insecure.org/nmap/ ) at 2005-05-13 18:33 EDT All 1660 scanned ports on atlorca2.atl.hp.com (15.50.65.104) are: filtered Nmap run completed -- 1 IP address (1 host up) scanned in 372.664 secondsTroubleshooting at the Transport Layer (TCP and UDP)There are times when error conditions take place at the higher layers of the network stack and are not easily identified or rectified. Troubles at the lower layers are usually more evident. Examples of lower layer issues are when packets do not get routed or interfaces do not initialize. Attempting to explain why a host cannot communicate with another host or has impaired communication, however, might require troubleshooting at the transport layer. In this section, we cover two protocols for the IPv4 model: Transmission Control Protocol (TCP) and User Datagram Protocol (UDP). Most administrators already know the significant difference between these two protocols. In short, TCP often is referred to as a "reliable connection," whereas UDP often gets chalked up as "unreliable." "Unreliable" is kind of a harsh way of putting it. TCP is referred to as "reliable" because of how the protocol performs built-in checks. UDP does not contain these built-in checks; therefore, the overhead of the protocol is reduced. The lack of overhead enables UDP transfers to be several times faster than their TCP counterparts. Another point of note is that some protocols at the application layer contain reliability checks, so the TCP reliability mechanism makes these checks redundant. In either case, communication at this layer is accomplished through sockets. Whether a transfer is made through TCP or UDP, the client must acquire a local port to depart the machine. Attaching a port to the end of an IP address creates an entity referred to as a "socket." After the client application acquires a local socket, it proceeds with communication to the remote socket. Client applications are not allowed to use a certain range of ports. This range applies to both TCP and UDP and is referred to as the "well-known" port range. These ports are reserved for services such as TELNET, SSH, FTP, NTP, and so on. The ports that fall into this category are below 1024, and depending on which RFC is applicable, ports 0255 are "well-known," whereas the ports below 1024 are the "privileged," meaning that only superuser can bind() to them. It is possible for a client application, running as root, to attempt to use some of these ports; however, besides breaking the RFC standard, such an attempt most likely would result in an error stating that the port is already in use. The "well-known" and privileged ports usually refer to the service (daemon) that is listening for inbound communication. Some client applications bind() to the privileged ports to perform their communications, however. Examples of these include NFS and the Berkley r commands (remsh, rcp, and so on). It is easy to see how NFS does this because it takes a root user to mount a filesystem, but the Berkley r commands get away with it because of the Set UID bit set on the program. # ls al /usr/bin/rcp -rwsr-xr-x 1 root root 15964 2004-10-01 21:14 /usr/bin/rcp Because the "S" is on the owner, and the owner is root, this program is executed as superuser. Other client applications must pick from the unprivileged port range. This range is said to be simply above 1024; however, a lot of these ports have been registered with the Internet Assigned Numbers Authority (IANA). In fact, the ports in the range of 102449151 have been registered. That is not to say that they cannot be and are not used by applications as temporary ports, however. Most UNIX kernels have an anonymous port range from which client applications can select a port. In Linux, this range is 3276861000, which can be dynamically changed. For comparison, HPUX sets this range to 4915265535. More about the port ranges can be found at http://docs.hp.com/en/5990-7252/ch01s01.html?btnNext=next%A0%BB. The anonymous port range in Linux can be determined with the following command: # cat /proc/sys/net/ipv4/ip_local_port_range 32768 61000 To change the port range, you issue a command like this: # echo "49152 65535" > /proc/sys/net/ipv4/ip_local_port_range To view the change, you check it with this command: # cat /proc/sys/net/ipv4/ip_local_port_range 49152 65535 UDPThis protocol does not maintain a connection state, nor does it perform any flow control. It is possible for a datagram to be dropped along the way if a portion of the network segment is unable to forward the datagram for some reason. It is up to the application to check for the packet loss and resend if needed. This connectionless protocol has little overhead. The local machine creates a datagram and sends it out over the wire, and most of the time, it waits for a response. It is up to the application to have built-in timeout and error handling in case a response never returns. In the next trace, the datagram's destination is a machine's time server port. If we are fortunate, the remote machine will have the NTP daemon running, and we will get a response. When the server receives the NTP datagram, it will respond with the destination port set to the original source port for which the client application should be listening for a reply. If the server is not listening for communication on the destination port, or even if the server does respond and the client application has already died, we should receive or generate an ICMP type 3 error message. Troubleshooting a program utilizing the UDP protocol can be somewhat difficult. When performing network traces, there is no sequence number or acknowledgment to reference. As mentioned previously, the application must be responsible for error checking or for placing a timeout if a response is never returned. An understanding of the fundamentals of how the UDP transfer takes place helps us to know where to begin the troubleshooting process. Figure 13-8 conveys an illustration of a UDP header. Figure 13-8. A UDP header The following ethereal TRace snippet illustrates a client sending a UDP datagram to a network time protocol server. It demonstrates where the UDP protocol is placed in relation to other layers detailed earlier in this chapter. Frame 34 (90 bytes on wire, 90 bytes captured) Ethernet II, Src: 00:12:79:3e:09:ec, Dst: 00:09:5b:24:65:3a Internet Protocol, Src Addr: 15.50.74.105 (15.50.74.105), Dst Addr: 16.54.97.90 (16.54.97.90) User Datagram Protocol, Src Port: ntp (123), Dst Port: ntp (123) Source port: ntp (123) Destination port: ntp (123) Length: 56 Checksum: 0xbc5e (correct) Network Time Protocol Communication at the transportation level requires two end points, whether TCP or UDP is the protocol. As with the previous example NTP trace, an IP.PORT exists for both ends. Of course, these are referred to as "sockets." Just as does TCP, the first thing the server program does is to create a socket file descriptor through the socket() system call. Then the server performs bind() to bind that socket descriptor to a socket (IP and PORT). This operation refers to the earlier discussion of port ranges and, if applicable, binds to privileged or unprivileged ports. In this example (NTP), bind() uses a privileged port of 123, which is also a "well-known" port. The last step is for the server to listen for datagrams to come in on the port and for the application to process these messages. The application calls recvfrom(), which is blocked until data is received. Next, the client must perform the same socket() system call. After doing so, it can perform a bind() to set the local interface and port for which to listen for replies. Bind() is usually only done by the server, yet some client applications perform this operation (for example, ntpd). In addition, if a client program is maintaining the communication to the server, the client uses the connect() system call to specify the destination port and IP. This connection does not have the same meaning as with TCP connections: It only stores the target IP and port for future communications. An example of this can be found with the latest ntpd daemon. Now that the local socket is ready, the client uses sendmsg() or another send() system call to send a datagram to the server. After the datagram arrives, the servers recvmsg() unblocks on an interrupt and passes the datagram up to the application for further processing. At this point, the communication is up and running. If, however, a client or the server issues a close() on the connection, a message is not sent to the other node. Hence, the reliability factor comes into play. This is usually more of a coding issue or the result of someone shutting down the system before the applications are stopped properly. In troubleshooting UDP issues, start with tracing the application to see exactly what it is doing. Look for obvious things such as the program performing a recvfrom() without using an alarm() or some other timeout mechanism. Then move on to the ethereal, tcpdump, and netstat programs. Of course, determine whether this is the only machine experiencing the problem because, if so, maybe a network profiling appliance is needed. TCPThe last protocol at this layer that we cover in this book is the Transmission Control Protocol (TCP). It is referred to as "reliable" because of how it makes its connection to the destination socket. To clarify, a UDP transfer simply creates a datagram and sends it out over the wire hoping that it makes it to the other end point. TCP transfer first establishes a connection to the end points before sending data, however. TCP has much more overhead than UDP. The key differences between the two protocols primarily are in the Sequence Number, Acknowledgment Number, Window, and TCP Flags. When troubleshooting the TCP protocol, these are the fields to which to pay attention. That is not to say that the others are unimportant; however, most solutions come from the sequence numbers and the flags that are set. These fields enable this protocol to maintain flow control, error handling, full duplex, buffered transfers, and order of delivery. Figure 13-9 is an illustration of the 32-bit TCP header. Figure 13-9. A TCP header A breakdown of the TCP header includes the following:
Flow control is maintained through the sequence. These sequence numbers are at each end of the data flow. When the ACK flag is set, the acknowledgment number of the sender is the next expected sequence. When the sending host receives an ACK for data sent, it can remove that data from the kernel buffer. Large problems result if either of the hosts starts receiving segments out of order. This causes an ACK to be sent for the last inorder segment; thus, you would have the possibility of at least one more ACK for the one segment. This could stack up, causing congestion on the network and resulting in a considerable network slowdown. An example of this would be to cause a 100Mbps network to run at 10Kbps (see Scenario 13-5, "FTP Slows Down When Transferring from One Machine to Another"). An example of sequence numbers of an FTP data transmission in action follows.
An initial SYN is sent from the server to the client to establish the DATA connection. The server specifies 1118533542 as a random value from which to start counting.
This is the SYN ACK from the client to the server. The ACK is the SEQ value supplied by the server + 1. The incremented value informs the server that the segment was correctly received and not just a guess ("piggy back"). The ACK value is the random value from which the client starts counting for bytes transferred from client to server as mentioned previously.
Notice the ACK from the server to the client, which completes the three-way handshake for establishing the TCP connection. The SEQ value is incremented as per the ACK value from the client, and the ACK value is the recognition of the random value used by the client for counting bytes transferred +1. At this stage, the DATA connection is now established. The next frame shows the actual file data being transferred from client to server.
When data is flowing, the ACK value is increased by 1460, which is the number of bytes sent in the previous packet. This is correct because it is saying that 1460 bytes of data have been sent from client to server. As in this example, if data were only flowing in one direction (such as a get or put in an FTP transmission), we would expect the SEQ numbers to remain the same and the ACK value to increase. TCP offers the capability for a host to receive several segments before having to send an acknowledgment. By so doing, it greatly increases the performance of the data flow. Known as "sliding window," the TCP header field "window" controls this feature. In short, the window is an advertisement from the sender informing the destination host that the sending host will accept x bytes of data before having to send an ACK, essentially cutting down on the data transmissions to increase bandwidth. The "window," which is advertised, can be large or small and is always being adjusted by the kernel algorithms. A smaller window informs the sending device to slow down the rate of outbound packets, whereas a larger window informs the sender to ramp up the amount of data sent. This "window" refers to a receive buffer on the sending host. It is a smaller area inside a large receive kernel buffer. When an ACK has confirmed that the data has been received, the window "slides" down, at which point the sender's kernel can now remove the old transmission from the buffer. An API can set this window by using the setsockopt() system call and SO_RCVBUF (see the socket(7) man page for more details). Most applications leave this up to the kernel algorithms in the TCP stack, which is recommended. Besides the obvious difference in the header, this protocol also uses a three-way handshake." This is significant because it identifies the originator by the sequence number mentioned previously. Figure 13-10 presents a demonstration of the TCP connection. Figure 13-10. The TCP connection Now the data can be sent back and forth . . . ACK . . . ACK . . . Next, the shutdown of the connection can be represented, as shown in Figure 13-11. Figure 13-11. Shutdown of the TCP connection The application that makes use of the TCP protocol appears slightly different from UDP applications. For example, on the server, a socket() call to acquire a socket descriptor and bind() call to assign a network socket to the file descriptor are made. At this point, the similarities stop, and the server application calls the listen() and accept() system calls. This sets up the daemon to listen for incoming connections on a particular port. Next is an example of SSH and how it sets up to listen for connections. # netstat -an | grep LISTEN tcp 0 0 :::22 :::* LISTEN The following is a portion of a trace performed on the same sshd daemon. # Gather a socket Descriptor 578 32728 0.000095 [ffffe410] socket(PF_INET6, SOCK_STREAM, IPPROTO_TCP) = 3 <0.000011 ... # Next we see the bind() system call bind a socket to the Socket Descriptor ... 582 32728 0.000066 [ffffe410] bind(3, {sa_family=AF_INET6, sin6_port=htons(22), inet_pton(AF_INET6, "::", &sin6_add r), sin6_flowinfo=0, sin6_scope_id=0}, 28) = 0 <0.000026> ... # Setup Listen() ... 609 32728 0.000095 [ffffe410] listen(3, 128) = 0 <0.000037> ... # A connections was made to the daemon, call accept() ... 713 32728 17.001662 [ffffe410] accept(3, {sa_family=AF_INET6, sin6_port=htons(34732), inet_pton(AF_INET6, "::ffff:12 7.0.0.1", &sin6_addr), sin6_flowinfo=0, sin6_scope_id=0}, [28]) = 4 <0.000009> ... # Now the sshd daemon clones a new thread and the connection goes to an established state.A socket connection can exist in one of several states at any given time. Most users will only ever see a few of these states, however, because transition from one state to another is performed so quickly. A TCP transitional diagram is included with RFC793, located at http://www.cse.ohio-state.edu/cgi-bin/rfc/rfc0793.html. The most common states regarding a new connection are LISTEN, SYN_SENT, SYNC_RECV, and ESTABLISH. These states normally can be seen with netstat; however, the two SYNCs are harder to catch with netstat unless there is a problem with getting packets from one side of the connection to the other. Listed here are the TCP states right out of the source code in linux/net/ipv4/tcp.c source. ... * Description of States: * * TCP_SYN_SENT sent a connection request, waiting for ack * * TCP_SYN_RECV received a connection request, sent ack, * waiting for final ack in three-way handshake * * TCP_ESTABLISHED connection established * * TCP_FIN_WAIT1 our side has shutdown, waiting to complete * transmission of remaining buffered data * * TCP_FIN_WAIT2 all buffered data sent, waiting for remote * to shutdown * * TCP_CLOSING both sides have shutdown but we still have * data we have to finish sending * * TCP_TIME_WAIT timeout to catch resent junk before entering * closed, can only be entered from FIN_WAIT2 * or CLOSING. Required because the other end * may not have gotten our last ACK causing it * to retransmit the data packet (which we ignore) * * TCP_CLOSE_WAIT remote side has shutdown and is waiting for * us to finish writing our data and to shutdown * (we have to close() to move on to LAST_ACK) * * TCP_LAST_ACK out side has shutdown after remote has * shutdown. There may still be data in our * buffer that we have to finish sending * * TCP_CLOSE socket is finished */ ... As with the building of the TCP connection, the teardown states are mostly unseen upon issuing the netstat command at arbitrary intervals. If any are seen, such as FIN_WAIT_2, which does not have a timeout value specified in the RFC, they are seen because a FIN was not received from the remote connection. If your system is plagued by this situation, it normally is attributable to an application bug. On some UNIX operating systems, a FIN_WAIT_2 simply would linger around until a system reboot or kernel hack was performed. For example, even though the RFC does not provide for a timeout for a FIN_WAIT2, the Linux kernel provides a way with /proc/sys/net/ipv4/tcp_fin_timeout. Review of the source file linux/net/ipv4/tcp.c shows this feature in action. Just as with all the dynamic kernel parameters, Linux's network parameters can be found under the magical /proc filesystem. The vast majority of these network kernel tunables are located in the /proc/sys/net/ipv4 directory and, depending on the kernel release, consist of over 240 files. Of these files, about 40 deal with TCP connections. For details on these parameters, see the kernel source and sites on the Internet such as http://ipsysctl-tutorial.frozentux.net/ipsysctl-tutorial.html#TCPVARIABLES. Scenario 13-2: UDP and Network Time ProtocolWhile trying to set up an NTP client, the administrator configures the wrong IP address into the ntp.conf file. After the administrator starts the ntp daemon, he notices that the time never synchronizes. Check for the synchronization, as demonstrated here. # ntpq -pn remote refid st t when poll reach delay offset jitter ========================================================================= 15.228.74.53 .INIT. 16 u - 1024 0 0.000 0.000 4000.00 Next determine how long the daemon has been running. # ps -ef | grep ntp ntp 32166 1 0 12:49 ? 00:00:00 /usr/sbin/ntpd # date Tue May 10 14:10:54 PDT 2005 Note that the daemon has been running for about one hour and twenty minutes. Now determine whether the NTP daemon has sockets that are held open. atlorca2: # lsof -p 32166 COMMAND PID USER FD TYPE DEVICE SIZE NODE NAME ntpd 32166 ntp cwd DIR 8,35 144 82232 \ var/lib/ntp ntpd 32166 ntp rtd DIR 8,35 144 82232 \ /var/lib/ntp ntpd 32166 ntp txt REG 8,35 808340 82110 \ /usr/sbin/ntpd ntpd 32166 ntp mem REG 8,35 209718 19367 \ /lib/ld-2.3.3.so ntpd 32166 ntp mem REG 8,35 659679 19393 \ /lib/tls/libm.so.6.1 ntpd 32166 ntp mem REG 8,35 45629 23482 \ /lib/libcap.so.1.92 ntpd 32166 ntp mem REG 8,35 2358847 19392 \ /lib/tls/libc.so.6.1 ntpd 32166 ntp mem REG 8,35 87223 19381 \ /lib/libnss_files.so.2 ntpd 32166 ntp 0u CHR 1,3 46349 /dev/null ntpd 32166 ntp 1u CHR 1,3 46349 /dev/null ntpd 32166 ntp 2u CHR 1,3 46349 /dev/null ntpd 32166 ntp 3u unix 0xe00000408798c380 46262 socket ntpd 32166 ntp 4u IPv4 46266 UDP *:ntp ntpd 32166 ntp 5u IPv6 46267 UDP *:ntp ntpd 32166 ntp 6u IPv4 46268 UDP \ localhost:ntp ntpd 32166 ntp 7u IPv4 46269 UDP \ atlorca2.atl.hp.com:ntp ntpd 32166 ntp 9w REG 8,35 220 82246 /var/log/ntp Note that at this point, the application simply is awaiting a response. Performing a network trace, as demonstrated here, can lead us to a solution. No. Time Source Destination Protocol Info 234 17.074282 15.50.65.104 15.228.74.53 NTP NTP Frame 234 (90 bytes on wire, 90 bytes captured) Ethernet II, Src: 00:30:6e:f4:26:ec, Dst: 00:d0:04:e2:ab:fc Internet Protocol, Src Addr: 15.50.65.104 (15.50.65.104), Dst Addr: 15.228.74.53 (15.228.74.53) User Datagram Protocol, Src Port: ntp (123), Dst Port: ntp (123) Source port: ntp (123) Destination port: ntp (123) Length: 56 Checksum: 0xb218 (correct) Network Time Protocol Flags: 0xe3 Peer Clock Stratum: unspecified or unavailable (0) Peer Polling Interval: 6 (64 sec) Peer Clock Precision: 0.000061 sec Root Delay: 0.0000 sec Clock Dispersion: 0.0000 sec Reference Clock ID: Unindentified reference source 'INIT' Reference Clock Update Time: NULL Originate Time Stamp: NULL Receive Time Stamp: NULL Transmit Time Stamp: 2005-05-10 17:52:02.9955 UTC No. Time Source Destination Protocol Info 237 17.074710 15.228.74.53 15.50.65.104 ICMP Destination unreachable Frame 237 (118 bytes on wire, 118 bytes captured) Ethernet II, Src: 00:10:83:fd:2d:5c, Dst: 00:30:6e:f4:26:ec Internet Protocol, Src Addr: 15.228.74.53 (15.228.74.53), Dst Addr: 15.50.65.104 (15.50.65.104) Internet Control Message Protocol Type: 3 (Destination unreachable) Code: 3 (Port unreachable) <-- indicates that the port is not listing for NTP traffic Checksum: 0xa7f9 (correct) Internet Protocol, Src Addr: 15.50.65.104 (15.50.65.104), Dst Addr: 15.228.74.53 (15.228.74.53) User Datagram Protocol, Src Port: ntp (123), Dst Port: ntp (123) Source port: ntp (123) Destination port: ntp (123) Length: 56 Checksum: 0xb218 (correct) Network Time Protocol Flags: 0xe3 Peer Clock Stratum: unspecified or unavailable (0) Peer Polling Interval: 6 (64 sec) Peer Clock Precision: 0.000061 sec Root Delay: 0.0000 sec Clock Dispersion: 0.0000 sec Reference Clock ID: Unindentified reference source 'INIT' Reference Clock Update Time: NULL Originate Time Stamp: NULL Receive Time Stamp: NULL Transmit Time Stamp: 2005-05-10 17:52:02.9955 UTC Observing a network trace with ethereal, we see the exact problem. The destination machine has nothing that is listening on the destination port; therefore, an ICMP error message is returned. Because the ntpd daemon does not care about this message, it does not die; rather, it just keeps running, hoping that at some point the ntp server will have a time server running on the destination port. There are times when tracing an application assists in identifying a problem with UDP transmissions. As already demonstrated in this chapter, for hosts to communicate, they must possess an IP. However, most people cannot remember that 64.233.187.99 is one of the IPs for www.google.com. Domain name resolution is left up to the DNS subsystem. This protocol makes use of UDP datagrams to make transfers as fast as possible. As a user, you want the hostname resolution to be seamless and almost instant, and UDP makes this possible. Scenario 13-3: UDP and Slow DNS LookupsSuppose your users are having a difficult time communicating on your intranet. All IP communication appears to be slow at times, and the users cannot figure out the reason for the slow communication. All hostnames are resolving; however, this process sometimes takes a few seconds. A simple test can help identify the problem. We use the host command (which replaces nslookup on Linux) to see whether a simple name resolution has a problem. If it does not, we can proceed either with dig (if we believe the problem is located with the name server) or with performing network traces. See the following example. # strace -f -F -i -r -t -T -v -o /tmp/dns.lookup.trace host \ www.google.com www.google.com has address 64.233.161.99 Notice that the machine did take a second to return. Let us take a look at the application trace. ... 22233 0.000040 [ffffe410] socket(PF_INET, SOCK_DGRAM, IPPROTO_UDP \ <unfinished ...> ... 22233 0.000043 [ffffe410] sendmsg(20, \ {msg_name(16)={sa_family=AF_INET, sin_port=htons(53), \ sin_addr=inet_addr("15.50.7 4.40")}, msg_iov(1)=[{"\310\360\1\0\0\1\0\0\0\0\0\0\3www\6google\3com\0\0\1\0"..., \ 32}], msg_controllen=0, msg_flags=0}, 0 \ <unfinished ...> ... 22233 0.000063 [ffffe410] futex(0x805a330, FUTEX_WAIT, 3, NULL \ <unfinished ...> 22235 0.000034 [ffffe410] select(21, [3 20], [], NULL, NULL \ <unfinished ...> 22234 4.999361 [ffffe410] <... futex resumed> ) = -1 ETIMEDOUT \ (Connection timed out) <5.000466> 22234 0.000092 [ffffe410] gettimeofday({1115759285, 549580}, NULL) \ = 0 <0.000024> 22234 0.000074 [ffffe410] futex(0x805a330, FUTEX_WAKE, 1 \ <unfinished ...>Not shown in the application trace is the fact that the application spawns several processes that simply are waiting on a reply from the DNS server, one such process being PID 22234, which is performing a "fast" user space mutex lock. After 4.99 seconds, the program's timer goes off, and the timeout is reached. The mutex simply is resumed; however, the reply from the DNS server for which we have been waiting returns, waking up the process. ... 22233 0.000029 [ffffe410] futex(0x805a2f8, FUTEX_WAKE, 1) = 0 \ <0.000022> 22233 0.000088 [ffffe410] recvmsg(20, \ {msg_name(16)={sa_family=AF_INET, sin_port=htons(53), \ sin_addr=inet_addr("15.50.74.40")}, \ msg_iov(1)=[{"\310\360\201\200\0\1\0\1\0\0\0\0\3www\6google\3com\0\0"..., \ 65535}], msg_controllen=20, msg_control=0x8082218, , msg_flags=0}, 0) \ = 48 <0.000025> 22233 0.000385 [ffffe410] fstat64(1, {st_dev=makedev(0, 9), \ st_ino=3, st_mode=S_IFCHR|0600, st_nlink=1, st_uid=1000, st_gid=5, \ st_blksize=1024, st_blocks=0, st_rdev=makedev(136, 1), \ st_atime=2005/05/10-17:08:00, st_mtime=2005/05/10-17:08:00, \ st_ctime=2005/05/10-16:13:47}) = 0 <0.000006> 22233 0.000122 [ffffe410] mmap2(NULL, 4096, PROT_READ| PROT_WRITE, \ MAP_PRIVATE|MAP_ANONYMOUS, -1, 0) = 0x409b0000 <0.000025> 22233 0.000098 [ffffe410] write(1, "www.google.com has address \ 64.23"..., 42) = 42 <0.000348> ...Assume that another trace on the program reveals that the system call was almost instant, taking only a few milliseconds. This causes us immediately to suspect that not all the network traffic is experiencing this slow behavior. After reviewing a network trace, we determine that only the DNS UDP datagrams were taking five seconds, and that even this appeared to occur only after the router device flushed its DNS cache. The following is a small portion of the ethereal trace taken from the previous test. No. Time Source Destination Protocol Info 3 2.504490 15.50.74.105 15.50.74.40 DNS Standard query A www.google.com Frame 3 (70 bytes on wire, 70 bytes captured) Ethernet II, Src: 00:12:79:3e:09:ec, Dst: 00:09:5b:24:65:3a Internet Protocol, Src Addr: 15.50.74.105 (15.50.74.105), Dst Addr: 15.50.74.40 (15.50.74.40) User Datagram Protocol, Src Port: 33993 (33993), Dst Port: domain (53) Source port: 33993 (33993) Destination port: domain (53) Length: 36 Checksum: 0x69f0 (correct) Domain Name System (query) ... Then five seconds later . . . No. Time Source Destination Protocol Info 8 7.508797 15.50.74.40 15.50.74.105 DNS Standard query response A 64.233.161.99 Frame 8 (86 bytes on wire, 86 bytes captured) Ethernet II, Src: 00:09:5b:24:65:3a, Dst: 00:12:79:3e:09:ec Internet Protocol, Src Addr: 15.50.74.40 (15.50.74.40), Dst Addr: 15.50.74.105 (15.50.74.105) User Datagram Protocol, Src Port: domain (53), Dst Port: 33993 (33993) Source port: domain (53) Destination port: 33993 (33993) Length: 52 Checksum: 0x7ef8 (correct) Domain Name System (response) Notice that there are no sequence numbers, so putting together a timeline would be very difficult if this machine were generating a large amount of DNS lookups at the time the trace was performed. Of course, other applications that use UDP, such as NFS, use an addition protocol called Remote Procedure Calls (RPC), which generates a unique number for a sequence enabling the application to place the datagrams back together to service the request. The solution in this case was to simply change the client's name server to a newer system that was not having a problem serving DNS requests. Scenario 13-4: Under Heavy Load Conditions, the System Experiences UDP Packet LossWe could see this type of problem with netstat, as in the following example. # netstat -us Udp: 250560 packets received 3318 packets to unknown port received. 8252 packet receive errors 233373 packets sent While still under a UDP load, we rerun the netstat command every few seconds to get a good sampling. # netstat -us Udp: 260175 packets received 3318 packets to unknown port received. 8617 packet receive errors 242987 packets sent Note that about 10,000 requests were sent out, and about 360 have been erroneous. The test generated from another client source results in the same behavior on the server. Notice that when different hardware configurations are tested, we get the same results in the example. Thus, we attempted to increase the network buffer, as indicated here. #sysctl -w net.core.rmem_max=524288 #sysctl -w net.core.wmem_max=524288 #sysctl -w net.core.rmem_default=524288 #sysctl -w net.core.wmem_default=524288 Notice that the symptoms remain. We then pursue the following thought process:
We then proceed with the following questions and courses of action:
Solution 13-4The error was detected at the application level. When the server opened the sockets, it set the buffer receiving size to 4KB with the setReceiveBufferSize method in the class DatagramSocket. A change was made to delegate this operation to the OS rather than to manual setting of the application. Then the problem subsided. Scenario 13-5: FTP Slows Down When Transferring from One Machine to AnotherIn this scenario, the problem is that of all the Ethernet cards on a single machine, one particular interface is slowing down. The slow interface is a virtual interface, eth1:2. Furthermore, eth1, eth1:1, and eth1:0 are not experiencing the problem. Because the driver is not different between the cards or the hardware, we can rule out a problem with the host immediately. Note that we've changed the IP addresses from their originals. Normally, we would not begin with a network trace. Every situation has to have an action plan devised, either in writing (as in our case) or in memory. Do not start with the big guns, such as kernel traces, profiling, hardware packet analyzers, and so on. First of all, it takes years of experience to know what to look for and to become proficient at using all those tools. In this case, an strace on the FTP process would not be of much assistance because we know that none of the other interfaces are experiencing the problem and because the issue could not be located at the OS level. Keep in mind, however, that if the user were transferring to a slow disk, it could have been an issue, but we have the user confirm that he was placing the data in the same location at each test. We begin with a network trace: tcpdump -i interface -s 1500 -w /tmp/trace.out Frame 48123 (1514 bytes on wire, 1514 bytes captured) Ethernet II, Src: 00:12:79:3E:09:EC, Dst: 00:12:79:58:E0:5E Internet Protocol, Src Addr: 4.4.4.131 (4.4.4.131), Dst Addr: 10.3.194.90 (10.3.194.90) Transmission Control Protocol, Src Port: 40495 (40495), Dst Port: ftp- data (20), Seq: 3707061465, Ack: 3923484752, Len: 1460 Source port: 40495 (40495) Destination port: ftp-data (20) Sequence number: 3707061465 Next sequence number: 3707062925 Acknowledgement number: 3923484752 Header length: 20 bytes Flags: 0x0010 (ACK) Window size: 24820 Checksum: 0x3f9c (correct) FTP Data So, the next seq should be seq 3707062925; however, the machine receives other sequences. Where did the seq go? So the local machine sends an ACK back to the remote machine requesting the data. The remote machine continues to send data, and it must send an ACK saying that it is still waiting on the seq 3707062925. 48123 1.506367 4.4.4.131 10.3.194.90 FTP-DATA \ FTP Data: 1460 bytes 48124 1.506381 4.4.4.131 10.3.194.90 FTP-DATA \ [TCP Retransmission] FTP Data: 1460 bytes 48125 1.506423 10.3.194.88 10.3.194.88 TNS \ Request, Data (6), Data 48126 1.506429 10.3.194.88 10.3.194.88 TNS \ Response, Data (6), Data 48127 1.506430 10.3.194.88 10.3.194.88 TNS \ [TCP Retransmission] Request, Data (6), Data 48128 1.506431 10.3.194.90 4.4.4.131 TCP \ ftp-data > 40495 [ACK] Seq=3923484752 Ack=3707062925 Win=57344 Len=0 48129 1.506437 10.3.194.88 10.3.194.88 TNS \ [TCP Retransmission] Response, Data (6), Data 48130 1.506446 10.3.194.90 4.4.4.131 TCP \ [TCP Dup ACK 48128#1] ftp-data > 40495 [ACK] Seq=3923484752 Ack=3707062925 Win=57344 Len=0 48131 1.506488 10.3.194.88 10.3.194.88 TNS \ Request, Data (6), Data 48132 1.506494 10.3.194.88 10.3.194.88 TNS \ [TCP Retransmission] Request, Data (6), Data 48133 1.506531 10.3.194.88 10.3.194.88 TNS \ Response, Data (6), Data 48134 1.506541 4.4.4.131 10.3.194.90 FTP-DATA \ [TCP Previous segment lost] FTP Data: 892 bytes 48135 1.506540 10.3.194.88 10.3.194.88 TNS \ [TCP Retransmission] Response, Data (6), Data 48136 1.506553 4.4.4.131 10.3.194.90 FTP-DATA \ [TCP Retransmission] FTP Data: 892 bytes 48137 1.506575 10.3.194.88 10.3.194.88 TNS \ Request, Data (6), Data ... 48416 1.510945 10.3.194.88 10.3.194.88 TNS \ [TCP Retransmission] Response, Data (6), Data 48417 1.511006 10.3.194.88 10.3.194.88 TNS \ Request, Data (6), Data 48418 1.511012 10.3.194.88 10.3.194.88 TNS \ [TCP Retransmission] Request, Data (6), Data 48419 1.511021 10.3.194.88 10.3.194.88 TNS \ Response, Data (6), Data 48420 1.511025 10.3.194.88 10.3.194.88 TNS \ [TCP Retransmission] Response, Data (6), Data 48421 1.511032 10.3.194.88 10.3.194.88 TNS \ Request, Data (6), Data 48422 1.511035 10.3.194.88 10.3.194.88 TNS \ Request, Data (6), Data 48423 1.511040 10.3.194.88 10.3.194.88 TNS \ [TCP Retransmission] Request, Data (6), Data 48424 1.511041 10.3.194.88 10.3.194.88 TNS \ [TCP Retransmission] Request, Data (6), Data 48425 1.511068 4.4.4.131 10.3.194.90 FTP-DATA \ [TCP Fast Retransmission] FTP Data: 1460 bytes Here we go! It is 0.0047 seconds later when we get the seq we were waiting on. Frame 48425 (1514 bytes on wire, 1514 bytes captured) Ethernet II, Src: 00:12:79:3E:09:EC, Dst: 00:12:79:58:E0:5E Internet Protocol, Src Addr: 4.4.4.131 (4.4.4.131), Dst Addr: 10.3.194.90 (10.3.194.90) Transmission Control Protocol, Src Port: 40495 (40495), Dst Port: ftp- data (20), Seq: 3707062925, Ack: 3923484752, Len: 1460 Source port: 40495 (40495) Destination port: ftp-data (20) Sequence number: 3707062925 Next sequence number: 3707064385 Acknowledgement number: 3923484752 Header length: 20 bytes Flags: 0x0010 (ACK) Window size: 24820 Checksum: 0xe59e (correct) SEQ/ACK analysis FTP Data The problem is TCP retransmission. This is not to say that the remote machine is wrong in continuing to send data, even though it is getting packets from the local machine saying that it is still waiting for old data. Keep in mind that the remote machine believes the first seq will eventually make it to the local host, or that the local host's ACK of what it has already sent will come back. Only after several retries does the remote machine realize that it needs to resend the packet, which it does. Note that the overall problem here is not how the local and remote host handled the missing packet, but the fact that the packet was missing at all. From what we could tell, this packet loss was causing other issues, including a lot of stress on the ARPA transport software on one or both of the servers. It is possible that one of the cards or drivers on either the remote or local machine is missing packets; however, this does not stand up against the fact that other IPs on the same NIC are operational. The fact that the problem only seems to happen on certain IPs seems to indicate that the network is the cause of the issue. To test further, we recommend assigning another IP to lan1:3 (to possibly avoid any odd routing entries in the network equipment) and putting sniffers at both ends to see whether they detect these missing packets (eliminating the two servers from being the cause of the issue). Solution 13-5In our case, the customer's networking team comes back and informs the end user that a problem occurred with the switch and that it was being replaced. The switch was old and had out-of-date firmware. Instead of upgrading it, they simply replaced it with a newer switch. After the switch was replaced, the issue was resolved. Troubleshooting at the Application Level: The Final Layer of the TCP/IP ModelThis is the layer where we leave the "network" and rely on the application and kernel. Troubleshooting within this layer takes time because each program can have a different characteristic. The TCP/IP model groups three layers of the OSI model into this area. Protocols such as DNS, LDAP, and NetBios-NS, and even FTP, finger, TELNET, X Windows, HTTP, and SNMP reside in this layer. No one troubleshooting methodology applies to all these protocols; however, understanding where they sit in the grand scheme of the TCP/IP stack assists you in diagnosing and troubleshooting these protocols. All these protocols depend on the lower layers. The application layer, as shown earlier in this chapter, builds a data "bundle." This bundle is passed to the lower layer, transport (TCP/UDP), where it is either broken into smaller chunks or taken as-is and prepended with that layer's header. Then the TCP/UDP layer sends the segment down to the IP layer, where the IP header is prepended, and the result is called a datagram. From here, the kernel passes this datagram down to the link layer, where the MAC header is added, at which point the datagram becomes an Ethernet frame. Any one of these layers could cause a problem with an application. Always take the easiest approach first. Most of the time, we get lucky and discover that the problem is a simple configuration change. Never start with a network trace because this alone almost never provides a solution or, for that matter, a reasonable explanation for why the application is behaving the way it is. |
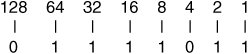
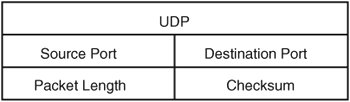
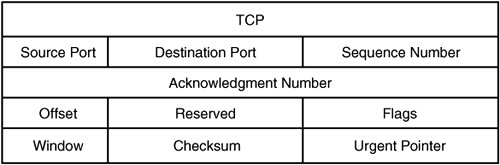
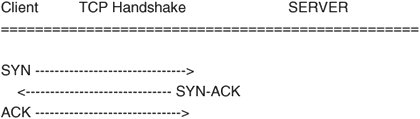
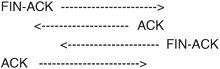
EAN: 2147483647
Pages: 129