5 Propagation modelling
5 Propagation modelling
In the face of unceasingly increasing demands, the operators were made to improve their networks: they increased the basic stations number and reduced cell size . The cell is the area zone covered by a base station. One generally distinguishes four kinds of cells (Figure 14.7). They sum up particular physical attributes of the base station antenna and its given geographical area: their characteristics are related to the power used, to the position and the height of the base station antenna and to the geographical environment.
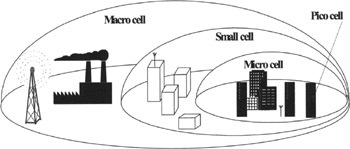
Figure 14.7: Various types of cells
The largest cell is the macro cell. The surrounding medium is in general rural or mountainous and the base station antenna is positioned at a very high point. The distance between the base station and the mobile can be greater than ten kilometers. This geographical area, little urbanised, involves a certain number of paths in great delays (up to 30 ¼ s). Moreover, the diffusers, being moved away and in a restricted number, do not generate very marked fast fading.
Facing the increasing number of mainly downtown users, it was necessary to reduce the cells size in order to cut down the re-use of the allocated frequencies distance. The most current of the established downtown cells is the small cell. It covers a ray of less amplitude than a few kilometers and the base station antenna is located above roof level. The maximum duration of the impulse response is 10 ¼ s.
In a very dense urban zone, the small cell is replaced by a micro cell which has an activity ray of a few hundreds of meters . For antennas under roof level, the wave propagation is guided by the streets . The maximum duration of the impulse response is 2 ¼ s.
There is finally the pico cell, of a few ten meters ray, which corresponds to a communication inside the buildings in which the antennas of the base stations are placed. The maximum duration of the impulse response is 1 ¼ s.
To each environment corresponds a certain number of models (theoretical, empirical or statistical, or semi empirical).
The theoretical models are based on the fundamental laws of physics with adequate approximations. The empirical models are based on the statistical analysis of a great number of experimental measurements carried out according to various parameters such as the frequency, the distance, the effective height of the emission antenna, the reception antenna, etc. The semi-empirical models combine an analytical formulation of physical phenomena (reflection, transmission, diffusion, diffraction ) and an adjustment of the variables using experimental measurements.
Propagation models are used when designing radio interface to optimise the performances and also during the systems deployment to determine the radioelectric cover.
We will only detail here the most-often adapted models to the deployment of communicating objects: the microcell model, ray launching model, penetration model and ray tracing model inside as well outside buildings.
5.1 Microcell model
Microcell modelling is built on a duality related to the short distances considered (a few hundreds of meters at most): a calculation of line of sight (LOS) and a calculation in non line of sight (NLOS). When the transmitter is located in the street below roof level, the propagation is guided along the streets: either in the street where is a transmitter (LOS), or in the adjacent streets after the passage of at least one corner (NLOS). We find these two kinds of calculation in the majority of the analytical models 2D (profile) suggested in the literature, in particular the double slope model [XIA, 1993] which considers an attenuation in d 2 (20log 10 d) for line of sight (LOS) at short distances and an attenuation in d 4 (40log 10 d) for non line of sight (NLOS) or for line of sight at long distances (combination of the direct path and the path reflected on the ground). The breakpoint is generally given by the following relation:
where h b and h m represent respectively the height of the emission station and the mobile one's.
In practice, it is very difficult to estimate the slope value in NLOS because it strongly depends on the angle ± between the streets. In fact, it works on the uniform theory of diffraction (TUD) [KELLER, 1962], [KOUYOUMJIAN, 1974] leading to a precise analytical formulation of the propagation phenomena in urban zones [BERTONI, 1994], [BERG, 1995], [JAKOBY, 1995].
An analysis of the propagation at 900 MHz and 1800 MHz on passing a street corner, by simulations carried out using electromagnetic methods (TUD) led to simplified analytical expressions for the propagation mechanisms in line of sight, reflection and diffraction depending on the origin and destination of widths streets of width respectively W 1 and W 2 , of distance from the transmitter to the corner (D), distance from the corner to the receiver (X), angle ± formed by the two streets and with emission frequency (Figure 14.8). Attenuation (Aff) on the level of the receiver after passing of the corner breaks up in the following way:
where:
AffVis is the line of sight attenuation at distance D
AffRef is attenuation due to the reflection [WIART, 1993].
with
-
f is the frequency used,
-
D is the distance between the transmitter and the street corner,
-
S represents the slope of the power decrease with passing of the street,
-
W 1 and W 2 are the street widths in line or in non line of sight,
-
X is the distance from the receiver to the street corner,
-
f( ± ) is a function of the angle ± of the street.
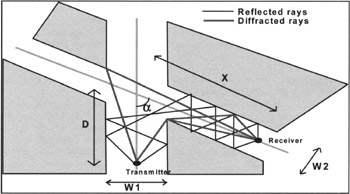
Figure 14.8: Standard case of the passage at a crossroads in microcell model
AffDif is the attenuation due to diffraction [WIART, 1993].
where:
To determine attenuation between a transmitter and a receiver, the model seeks all possible paths between the emission point and the reception point. The contributions delivered by the various paths are totalled in Watts, and the resultant is converted into decibels.
5.2 Ray launching model
The technique of ray launching is a particularly promising deterministic technique. Being based on very precise geographical data bases and on physical theory, it is particularly well adapted for urban environments and makes it possible to obtain computation results with very rich information like the impulse responses. It is for these reasons that, recently, many models using this technique have appeared, [KURNER, 1993], [LAWTON, 1994], [LIANG, 1998].
The RAY model developed by FTR&D is a model based on a technique of ray launching and is designed to carry out a systematic research of the paths connecting the transmitter to the receiver using a combination of the physical phenomena reflections, horizontal and vertical diffractions, penetration and crossing of vegetation. All these phenomena are deduced only from their theoretical values given by the uniform theory of diffraction (TUD) for diffractions and by the Fresnel and Beckmann formulae for the reflections.
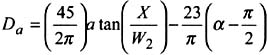
The traditional method is to launch, in all directions, a significant number of the guidelines starting from the transmitter. Each ray represents the part of the electromagnetic wave included in a cone around this guideline. For reasons of saving calculation, some assumptions make it possible to simplify the geometry of the problem. Figure 14.9 describes the actual steps followed [ROSSI, 1991], [ROSSI, 1992].
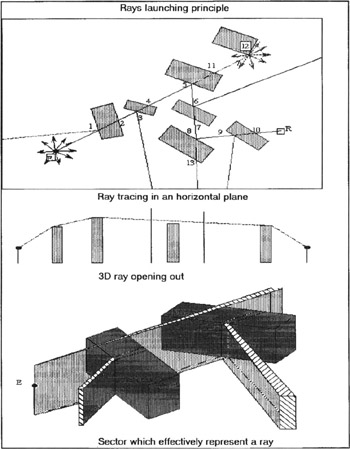
Figure 14.9: Principle of a ray launching model
Initially, only the horizontal plane is considered, ie the base station E as all the obstacles are represented by their vertical projection on this plane. Then the rays are sent, starting from the transmitter E, at regular angular intervals in the plane. At this stage, in 3D space, the ray does not represent any longer a cone around the ray but a vertical section of space. When a ray comes up against a building face (point 1 on Figure 14.9), it has the possibility either to pass over, or to be reflected. The two cases are explored by creating, starting from this point, two branches: one continues its way in a straight line, the other is directed in the specular reflection direction. The same duplication is produced each time the ray meets an obstacle until the ray i too much attenuated or comes out of the framework of the ground data. When the ray meets a receiver R, the third dimension is then considered by unfolding the ray according to its curvilinear co-ordinates on the viewgraph (Figure 14.9); the reflective buildings are represented there by a simple vertical bar. The way followed by the ray corresponds to the shortest way between the base and the mobile which passes above the diffracting buildings. Once this cut is obtained, the rigorous attenuation calculation on the connection is possible. The average power received by the receiver is the resultant of the powers of each ray arriving at this point.
Figure 14.10 gives an example of all the rays connecting a transmitter and a receiver whose power is in a dynamics of 20 dB.
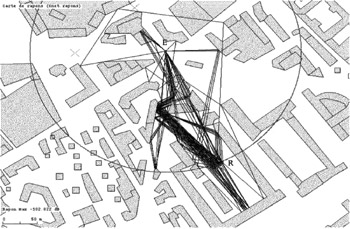
Figure 14.10: Diffracted and reflected rays between a transmitter (e) and a receiver (r) (ray model)
5.3 Penetration model
The penetration attenuation in a building is defined as being the power loss undergone by the electromagnetic field between the outside of the building and one or many positions inside the building. It is calculated by comparing the external field and the field in the parts of the building where the receiving mobile is situated. The attenuation models, integrated into the field prediction tools, must take into account the environment close to the building studied.
The parameters affecting the values of penetration attenuation are multiple and their effects intermingle most of the time. Among all these parameters, one generally distinguishes the following traditional parameters:
-
neighbouring environment. One will distinguish districts with more or less large open viewing towers from each other, and the more traditional districts comprising average height buildings.
-
depth of reception in the buildings. The field decreases when the mobile moves from the front towards the bottom of a room inside the building. The effect of the face inhomogeneities decreases when one approaches the bottom of the room. The waves penetrate much easier into the building through the glazed parts than the brick walls and consequently certain paths are more or less attenuated or even shut out. The glazed faces in general present a 6 dB penetration attenuation power compared to the unglazed faces [RAPPAPORT, 1994]. At the bottom of the building attenuation is more important but also much more homogeneous.
-
angle of incidence angle. It acts on the reflection and transmission coefficients through a surface.
-
reception height more commonly called "floor effect". In a general way this floor effect is expressed in the form of a reduction in the penetration attenuation or of a relative power gain compared to the lower floor in a small cell context (emission antenna located above the roof level). The calculation base is thus the penetration attenuation at ground floor determined comparative with the external field. In a small cell, the power gain observed is classically about 2 to 3 dB per floor at 900 and 1800 MHz. However, the strong diversity of the situations causes a dispersion of the gain by floor; values of about 4 to 7 dB were already measured in practice [GAHLEITNER, 1994]. The floors of the lower part are illuminated by rays undergoing a number of reflections and diffraction on the roofs and in the street whereas the floors of the higher part have the advantage of a much more significant illumination , sometimes even direct. The effects on the penetration are thus varied [RAPAPPORT, 1994] and [WALKER, 1983].
-
distance between the transmitter and the receiver, when the building sheltering the mobile is visible from the transmitting antenna. Then the penetration attenuation depends on the distance by the free space propagation law.
-
height of the emission antenna.
-
frequency.
-
type of crossed materials. The crossing of materials causes an electromagnetic wave attenuation, from about 4 dB (wood) to 10 dB (concrete) [COST231, 1999].
Various measurement techniques were developed to characterise the penetration attenuation due to building materials. One can in particular quote the method with two reverberating rooms [FOULONNEAU, 1996].
Most traditional models draw from the Motley Keenan model [MOTLEY, 1988] used for propagation inside the buildings. They take into account the penetration attenuation according to parameters such as:
-
the distance between the transmitter and the building external wall where the receiver is located,
-
the distance between the external wall and the receiver,
-
the number of internal walls cut by the profile,
-
the floor effect,
-
the attenuation of the building's external wall,
-
the attenuation of the internal walls.
The path loss (L) is expressed by a sum of the losses in free-space (L ), losses due to the obstacles crossed by the direct ray (flagstones, walls, doors, windows ), of a constant (L c ) [MOTLEY, 1988]. The data base can differentiate the various obstacles with which a particular attenuation value is associated. It is the most used model.
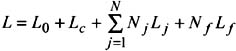
where:
-
N j is the number of crossed walls of type J,
-
L j are the losses due to walls of type J,
-
N is the number of the types of different walls,
-
N f is the number of crossed flagstones,
-
L f are the losses by flagstone.
5.4 Indoor modelling
Propagation inside buildings depends on the kind of environment: dense (buildings of office type), open (buildings of office type, large offices being able to accommodate several people), broad (buildings having very large rooms such as warehouses, airports, stations) and corridor (transmitter and receiver being located in the same corridor). It is also multi path: the predominant mechanisms are reflection, transmission, diffraction and scattering [HASHEMI, 1993b], [VALENZUELA, 1997].
5.4.1 Empirical models
One distinguishes the profile models by distance, the Motley-Keenan profile type [KEENAN, 1990] and the multi-rays models called corridor model.
In the case of the profile models at a distance, the parameters taken into account are the frequency and the distance between the transmitter and the receiver. Two models are proposed, the first [COST231, 1999] supposes a logarithmic dependence of attenuation of function of the distance, the second supposes a linear dependence [COST231, 1999]. The two models are usable for situations of non line of sight.
The models of the Motley-Keenan type apply to the cases of non line of sight in a dense environment (office). The loss path (L), as in penetration, is expressed by a sum of the losses in free-space (L ), losses due to the obstacles crossed by the direct ray (flagstones, walls, doors, windows), and of a constant (L c ) [MOTLEY, 1988]. The data base can differentiate the various obstacles with which a particular value of attenuation is associated. It is the most used model.
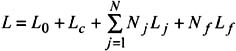
where:
-
N j is the number of crossed walls of type J,
-
L j are the losses due to the walls of type J,
-
N is the wall kinds number,
-
N f is the number of crossed flagstones,
-
L f are the losses by flagstone.
5.4.2 Deterministic models
In the ray launching technique, the models suggested are generally in 3 dimensions because the propagation medium is dense. Developed by many authors [RAPPAPORT, 1994], [SEIDEL, 1994], [CICHON, 1994], they lead to encouraging results [RAPPAPORT, 1994]. They constitute good references for the settling of the multipath model but remain of restricted use in engineering because of substantial computing time.
The ray tracing technique consists of building rays by using the image theory. It makes it possible to easily take into account the mechanisms of propagation (multiple reflections, diffractions, etc). This technique was used by many authors [MC KOWN, 1991], [COST231, 1999], [VALENZUELA, 1994], [JENVEY, 1994], [LAURENSON, 1993].
The two other approaches, the finite differences method [MURCH, 1994], [LAUER, 1994], and the Tayleig-Gans approximation [LU, 1993], use relations derived from Maxwell's equations. The propagation medium is meshed. The radioelectric field propagates, iteration after iteration, in space surrounding the transmitter. The computing time is very important because the mesh step must be lower than wavelength (about » /8). However, one currently does not have representative results of their performances, the methods being very recent.
5.5 Ray models
Ray models are deterministic models. They rest on a precise knowledge of the reality and require to have geographical data bases of "contour" type or interior of buildings. They make it possible to predict the various propagation paths in a given configuration. After adjustment with the frequency band considered, these models also make it possible by simulation to carry out parametric studies to analyse for example the influence of the antenna's diagram pattern or material characteristics, which is much more economic than the realisation of multiple series of measurements.
We give below, in illustration, two examples of ray tracing: one outside the buildings (Figure 14.11) and the other inside the buildings [CHAIGNEAUD, 2001a, 2001b, 2002] (Figure 14.12).
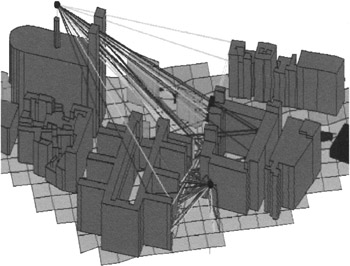
Figure 14.9: Example of ray tracing outside buildings
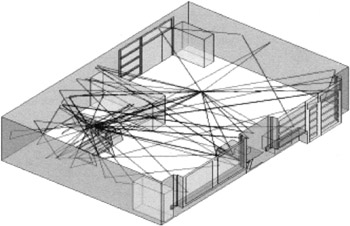
Figure 14.10: Example of ray tracing inside buildings
EAN: 2147483647
Pages: 191