CASE DESCRIPTION
|
|
MAI decided to engage Monash University in a three-year extended study which aimed to produce quantitative evidence of the benefits of data mining. Kate had a prospective PhD student, Angie Young, who was interested in data mining and was looking for sponsorship. MAI agreed to provide a scholarship for Angie to carry out the data mining research at MAI under the supervision of Kate.
Mark Brown, the Business Analysis manager, was in charge of co-ordinating the data mining project. He had worked in the company for more than twenty years and he knew the business very well. He was also familiar with the data and had knowledge of the processes behind the data collection. He was able to determine useful questions for analysis and select potentially relevant data to answer these questions.
MAI is driven by two main concerns: the need to return a profit to their shareholders and investors, and the need to achieve market growth and retain a certain level of market share. These two goals are seen as imperatives to success, but are often conflicting. Premiums play a critical role in enabling MAI to find a balance between these two goals. The challenge is to set premiums so that expected claims are covered and a certain profitability is achieved, yet not to set premiums so high that market share is jeopardised as consumers exercise their right to choose their insurer. In other words, MAI has to balance profitability and market share when setting premiums. This involves combining the results of three main tasks: risk classification, prediction of claim cost and price sensitivity analysis (see Figure 1). The initial study showed that data mining could be of benefit to premium setting, but the three-year extended study needed to show the quantitative benefits of the approach.
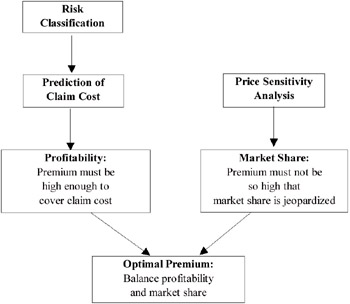
Figure 1: Balancing Profitability and Market Share
In the automobile insurance industry, companies adopt "class ratings" to determine premiums. Policy holders are assigned to various risk groups based on factors which are considered predictors of claim cost and premiums are charged based on the risk group to which they belong. An insurance company has to discriminate between good and bad risks so that they can engage in selective marketing, otherwise they may end up losing good customers due to uncompetitive premiums that are inadequate to compensate for the risks of customers of dubious quality. "Bad risks drive out good risks," when the same premium is charged (van Gelder, 1982). Another reason for discriminating between good and bad risks is so that premiums can be set equitably. The premium should be fair in the sense that each policy holder, or group of policy holders, should be charged a rate which reflects the policy holder's expectation of loss (Athearn, 1969; Denenberg, 1974).
Having classified policy holders into various risk groups, an insurance company has to decide on an appropriate method for predicting claim costs within each group. Currently MAI uses a point system. Each rating factor is scaled such that the higher the risk, the higher the points. For each risk factor, the policy holder will be assigned points. These points are aggregated for all factors and premium is charged accordingly. The higher the aggregated points, the higher the premium. The points system has some limitations however, and these will be illustrated with an example. For simplicity, we assume that points are assigned to policy holders based on only two factors: the policy holder's age and vehicle age (see Table 2). The aggregated points for the various risk groups are shown in Table 3. Continuing the illustrative example, Table 4 shows an example of what the cost ratio (claim cost/premium) matrix may look like for the various risk groups (claim cost and premium information have been intentionally omitted for brevity).
| Policy Holder Age Group | Points | Vehicle Age Group | Points |
|---|---|---|---|
| A | 50 | A | 0 |
| B | 40 | B | 1 |
| C | 35 | C | 2 |
| D | 30 | D | 3 |
| E | 25 | E | 4 |
| Policy Holder Age Group | |||||
|---|---|---|---|---|---|
| Vehicle Age Group | A | B | C | D | E |
| A | 50 | 40 | 35 | 30 | 25 |
| B | 51 | 41 | 36 | 31 | 26 |
| C | 52 | 42 | 37 | 32 | 27 |
| D | 53 | 43 | 38 | 33 | 28 |
| E | 54 | 44 | 39 | 34 | 29 |
| Policy Holder Age Group | |||||
|---|---|---|---|---|---|
| Vehicle Age Group | A | B | C | D | E |
| A | 57% | 65% | 74% | 75% | 72% |
| B | 54% | 57% | 70% | 78% | 71% |
| C | 58% | 48% | 71% | 75% | 76% |
| D | 66% | 62% | 72% | 83% | 79% |
| E | 72% | 72% | 83% | 94% | 70% |
Suppose the company is not happy with the cost ratio of 94% (policy holder age group D and vehicle age group E) and would like to increase the premium to cover the high claim cost of the risk group. Since the premium is calculated based on points, the company would have to either increase the points of policy holder age group D or vehicle age group E. However, this would this would increase the points for other cells in the row or column even though the company may be satisfied with their cost ratio. Ideally, premium should be charged based on a reflection of actual risk. We could change the points for that particular cell in isolation, but if many variables are considered this point system becomes very large and complicated
In determining optimal premiums, MAI has to be mindful of the effect of changes in premiums on retention rates. In a competitive environment, setting the premium at too high a level can lead to a loss in market share. The broad framework shown in Figure 1 was used in the initial study to guide the data mining tasks, and now became the basis of the three-year investigation.
A business analyst, Sophie Green, was recruited to carry out data mining. Sophie's background was in statistics and she was not familiar with data mining tools. Although she attended an introductory course in data mining run by Monash University shortly after she joined MAI, she found it difficult to use the Enterprise Miner. She did not know which tools were appropriate for analysis. She found herself going back to statistical analysis she was familiar with using an Excel spreadsheet.
Angie was not familiar with many of the terms of the insurance industry. She had to learn about the business before she could begin any data mining. She spent a substantial amount of time understanding the business. Mark was a great help in this respect. She also required the help of Mark to interpret intermediate results of the analysis. At times they found that the results indicated that there were problems with the data used for analysis and it was back to the drawing board.
Charles Long, a system analyst, was asked to extract data sets from the data warehouse. He knew what data was available, exactly where the data could be found and how different sources could be combined. Charles extracted two data sets (training and test sets) consisting of 29 variables and 12 months of comprehensive motor insurance policies of one of the Australian states, New South Wales. The training set consisted of 146,326 policies with due dates from 1 January to 31 December 1998 while the test set consisted of 186,658 policies with due dates from 1 July 1998 to 30 June 1999. Restricted by the availability of data at the time of collection, the period of overlap was to enable comparison of exposure and retention rates over a one-year period and to ensure that sample sizes are sufficiently large. Forty percent of the policies in the test set were new policies. The training set was used to train the models while the test set was used to evaluate the results.
Charles had to convert some of the variables into a format required for data mining. For example, age of policy holders and vehicles were computed based on date of birth and year of manufacture respectively. While Angie was obtaining some descriptive statistics of the data sets to familiarise herself with the data, she discovered some errors. For example, a few of the policy holders had an age of 999. She removed records with errors from the data sets. She also noticed that there were several types of excess and she aggregated the various amounts.
Nine months after the project began, Sophie resigned. Andrew Boyd was recruited to take her place but also resigned after a month. Angie found herself carrying out the project on her own. Although it was agreed that Angie was to make monthly presentations to the management of MAI on the progress of her research, it turned out that during her three years she only managed four presentations. It was difficult for the MAI management team (some based in Melbourne and others in Sydney) to find a common time slot for the presentations.
Angie met with Kate weekly to report on the progress of her research. With the help of Kate she was able to decide which data mining algorithm or tool was most suited to address the various research questions and interpret the results. At the end of her three-year research at MAI, Angie proposed a detailed data mining framework (see Figure 2) to determine the premiums to charge automobile insurance policy holders in order to arrive at an optimal portfolio.
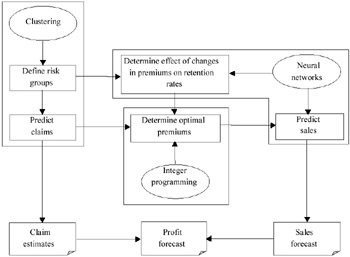
Figure 2: Data Mining Framework for Determining Optimal Premiums
The framework, which is a holistic approach, consists of three main components:
-
The first component involves identifying risk classifications and predicting claim costs using clustering. The total premiums charged must be sufficient to cover all claims made against the policies and return a desired level of profit.
-
The second component involves price sensitivity analysis using neural networks. Premiums cannot be set at too high a level as customers may terminate their policies thus affecting market share.
-
The third component combines the results of the first two components to provide information on the impact of premiums on profitability and market share. The optimal mix of premiums to achieve a pre-specified termination rate while maximising profit is determined by integer programming.
The first component of the data mining framework involves identifying risk classifications and predicting claim costs. In designing a risk classification structure, insurance companies attempt to maximise homogeneity within each risk group and heterogeneity between the risk groups. This can be achieved through clustering. The k-means clustering model was used to classify polices. The k-means clustering model performs disjoint cluster analysis on the basis of Euclidean distances computed from variables and seeds that are generated and updated by k-means algorithm (Anderberg, 1973; MacQueen, 1967). Least squares is the clustering criterion used to measure the distance between data observations and seeds. Using the least squares clustering criterion, the sum of the squared distances of observations to the cluster means is minimised. Thirteen variables were used for clustering. They were:
-
Policy holder's age
-
Policy holder's gender
-
Area in which the vehicle was garaged
-
Rating of policy holder
-
Years on current rating
-
Years on rating one
-
Number of years policy held
-
Category of vehicle
-
Sum insured
-
Total excess
-
Vehicle use
-
Vehicle age
-
Whether or not the vehicle is under finance
Having classified the policy holders into risk groups, the price sensitivity within each cluster was examined; the second component of the data mining framework. Neural networks were trained to classify policy holders into those who are likely to terminate their policies and those who are likely to renew. Neural networks are ideal tools for solving this problem due to their proven ability to learn to distinguish between classes, and to generalise their learning to unseen data (Bigus, 1996; Han & Kamber, 2001; Smith, 1999). A multilayered feedforward neural network was constructed for each of the clusters with 25 inputs, 20 hidden neurons and one output neuron (whether the policy holder renews or terminates to contract). The inputs consist of the thirteen variables used for risk classification plus the following premium and sum insured variables:
-
"old" premium (premium paid in the previous period)
-
"new" premium (premium indicated in renewal notice)
-
"old" sum insured (sum insured in the previous period) which was also included as input in the clustering model
-
"new" sum insured (sum insured indicated in renewal notice)
-
change in premium ("new" premium-"old" premium)
-
change in sum insured ("new" sum insured-"old" sum insured)
-
percentage change in premium
-
percentage change in sum insured
-
ratio of "old" premium to "old" sum insured
-
ratio of "new" premium to "new" sum insured
-
whether there is a change in rating
-
whether there is a change in postcode
-
whether there is a change in vehicle
Sensitivity analysis was then performed on the neural networks to determine the effect of premium changes on termination rate of each cluster. Separate data sets were created from each cluster with all variables remaining unchanged except for new premium and related variables. These data sets were scored against the trained neural networks to determine the predicted termination rates under variations of premium.
The third component of the data mining framework combines the results of the first two components to provide information on the impact of premiums on profitability and market share. The problem of determining optimal premium is akin to portfolio optimisation where an investor strives to find a balance between risk and return across their portfolio of investments (Markowitz, 1952). In portfolio theory, an asset has a given rate of return and risk. In the insurance optimisation problem, the termination rate and the profit earned from each cluster depend on the premium that is charged. Integer programming was proposed to determine the premium to charge for each cluster to maximise total profit for a given overall termination rate. The termination rates of individual clusters may vary to maximise the profit but the overall termination rate for the portfolio will be constrained by a user-defined parameter (Yeo et al., 2002)
The optimisation problem was solved for varying termination rates. The results are shown in Figure 3. The curve is similar to the efficient frontier of portfolio optimisation. It is a smooth non-decreasing curve that gives the best possible trade-off between profit and termination rate. If MAI selects an acceptable termination rate, the model will then determine a portfolio (mix of premiums to charge various risk groups) that maximizes profit. If MAI were to maintain its current termination rate of 11%, profits could be increased by changing the mix of premiums.
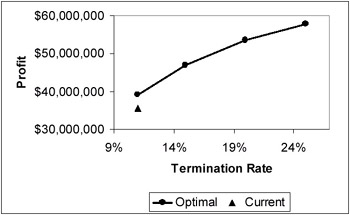
Figure 3: Optimal Profit for Varying Termination Rates
Thus Angie was able to provide MAI with clear evidence of the quantitative benefits of adopting a data mining approach to premium pricing.
|
|
EAN: 2147483647
Pages: 367
- Chapter I e-Search: A Conceptual Framework of Online Consumer Behavior
- Chapter X Converting Browsers to Buyers: Key Considerations in Designing Business-to-Consumer Web Sites
- Chapter XI User Satisfaction with Web Portals: An Empirical Study
- Chapter XII Web Design and E-Commerce
- Chapter XIII Shopping Agent Web Sites: A Comparative Shopping Environment