APPENDIX
|
|
-
Service Categories and Selected Services of CSA
Assets and Administration
Human Resources
-
Assets Registration
-
Document Management
-
Fleet Management (Vehicles/Equipment)
-
Procurement
-
Telecommunications
-
HR Reporting
-
Payroll Management
-
Recruitment and Employment
-
Workplace Health and Safety
Financial Services
Information Systems
-
Accounts Payable/Receivable
-
Financial Reporting
-
General Ledger
-
Taxation
-
Reporting
-
Intranet Services
-
Systems Development
-
Systems Operations
Corporate and Business Consultancy
-
-
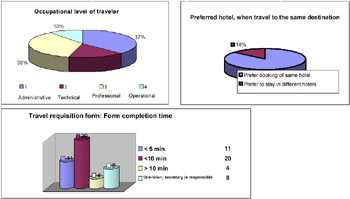
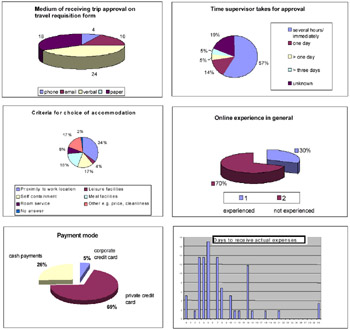
Statistical Results from Interviews with Travelers


Further results the project team assembled with this survey:
Out of 153 trips
-
150 had their destination in Australia (interstate).
-
129 had their destination in Queensland (intrastate).
-
The most common reason for business travel was projects and trainings.
-
The duration was always between one and four days.
-
The most used means of transport were Qfleet cars followed by Mantas flights. In exceptions other airlines were booked because of cheaper offers.
-
The most common accommodation is individually preferred hotels.
-
116 travelers chose for trip financing travel allowances.
-
-
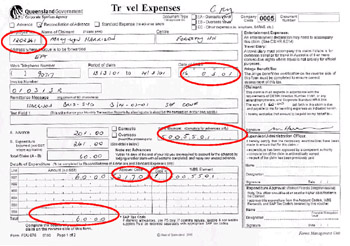
Travel Expenses Form

* Circled Areas Indicate Data Entered in SAP R/ 3 Financials
-
Travel Industry Background
The following trends and statistics given by the Travel Industry Association of America and the Travel Industry World Yearbook give an insight into the travel industry (Waters & Milman, 2001).
-
The U.S. civilian government spent some $3 billion on travel in fiscal 1999; the Defense Department about $5 billion; and the Department of Transportation, $273 million.
-
Asian-American travel volume has grown 7% from 1997 to 1999, increasing from 28.5 million to 30.4 million person-trips. Business trips represent 3 in 10 of the total person-trips taken by this group. (Source: The Minority Traveler, 2000 Edition)
-
Business travel has grown slightly since 1998, to 212.3 million person-trips in 1999. Thirty-six percent travel by airplane. Among overnight business trips, 85% stayed in a hotel or motel, which is up from 82% in 1998. (Source: Survey of Business Travelers)
-
The number of airline passengers worldwide in 1999 grew by 3.8% over 1998, to 1.34 billion.
Corporate travel expenses are an integral part of every company's budgetary concerns. Sometimes, these expenditures are even unaccounted in the organization's annual budget. Travel and related expenses account on average for 7% of the total operating costs, which are escalating to be the second largest controllable corporate expense. Travel costs were rising from 1996 to 1998 up to 13% and at the same time travel supplier commissions were cut. Where do these developments result from and who are the players in the travel industry? The travel market is not very transparent. The number of more than 125 airlines worldwide presents that the existence of many market participants, such as hotels, airlines, wholesale and retail travel agencies, and car rentals, makes the travel business very complex. The travel industry was throughout the 1990s one of the largest industries. The fact that about half of all travelers were business travelers indicates the importance of traveling for business purposes (Farhoomand, 2001). The increased popularity of network organizations and a trend towards outsourcing intensified the integration of organizations with their environment. Reasons to travel are attendance at conferences, workshops and training sessions and visits of business partners such as customers, prospectors, vendors, banks, logistical service providers, etc. Employees undertake also necessary travels for doing business. This includes activities as a part of mobile sales and services.
The travel market suppliers provide two main products which a business traveler requires: transport and accommodation. In most cases travel service suppliers do not directly distribute their services to the market. The services are sold to intermediary travel agencies, who allocate demand and supply as wholesalers or retailers to their customers. The various travel services are demanded by organizations, which consolidate the need for business travels of their employees. This demand is driven by the diverse travel purposes of each single business traveler. In comparison to leisure travelers, business travelers know their travel details and need far less time, assistance and expertise from travel agents. Note the organizational demand is less elastic to prices and economic conditions and therefore the profit margins are lower than in the leisure market. Profit margins in the business travel market are only about 5% (American Express, 1999).
Several different trends can be pointed out within the business travel market. Tight functional and financial relationships between suppliers and intermediaries characterize the market. For example, travel agencies are since the 1970s functionally linked to service suppliers via computer reservation systems (CRS). More than 70% of airline bookings are made through travel agents via CRS. The CRS with the highest market share, between 22% and 27%, are Amadeus, Sabre and Galileo. They enable travel agents and travel service providers to market and sell travel around the world. In addition, over 100 airlines and other travel service providers optimize their internal operational requirements and use the modular technology of CRS (Farhoomand, 2001).
The traditional supply chain and interconnections of the business travel market are shown in Figure 3. But organizations do not necessarily purchase all travel services from services suppliers. For example, organizations, in particular most government organizations, tend to support their own car fleets. That means organizations disclaim external purchases from car rentals if they reach the break-even point to support their own fleets. In conclusion, dependent on their travel demand, organizations have to undertake classical make-or-buy decisions. A major movement of the travel industry is based on the development of the Internet. New technology offers organizations to purchase business travel services directly from the service supplier with increased buying power. The need for intermediary travel agents reduces and therefore distribution and sales costs decrease. Buyers access directly the CRS of travel service suppliers and eliminate in this way parts of the legendary supply chain. Organizations have recently tended to establish long-term relationships with either service suppliers directly or with selected travel agencies. The underlying purpose of fixed contracts is to reduce transaction costs due to the stability of the relationship. Organizations want to ensure that travel suppliers are providing the most efficient, cost-effective travel services in congruence with their travel policies. Travel policies provide within each organization the backdrop for undertaking business travels. Organizations set up travel policies in order to streamline internally the need for travel in terms of purposes and expenses and to facilitate travel management. Travel policies advise when and for how much cost an employee is authorized to undertake business travels. This authorization is mostly dependant on the employee's position and responsibility.

|
|
EAN: 2147483647
Pages: 367