| In this section, we talk about various diagnostic tools and utilities we can use to monitor general system activity. We don't go into the detail of individual processes (that's for the next chapter); we just keep the discussion at the system application level, e.g., networking, LVM, disks, memory ”the level of monitoring that includes hardware diagnostics, monitoring the state of various hardware, software, and firmware resources. There are various tools and utilities that come with HP-UX that allow us to monitor general system activity, everything from syslogd and other standard logfiles to Event Monitoring System (EMS), to Support Tools Manager (STM) diagnostics. We look at utilizing all of these facilities to ensure that we are aware of what is happening on our system in relation to general hardware and software issues. Like most diagnostic/logging facilities, there is usually lots of information produced that goes unread. I hope that we can automate a number of these tasks to notify us only when something interesting and untoward happens. 10.2.1 syslogd The most commonly used facility for trapping hardware and software errors is syslogd . Unfortunately, because so many facilities use syslogd , the resulting logfile, /var/adm/syslog/syslog.log , commonly becomes overloaded with so much information that you can't decipher what is really happening. One of the first things I like to do is to separate all the networking information (except the mail system) away from syslog.log into a separate file. When a subsystem sends a message to the syslogd daemon, the message is tagged with a priority . The priority is made up of two dot-separated components ”a facility and a level . The facility is intended to identify the subsystem that sent the message. The level indicates the urgency of the message. Table 10-2 shows a quick reminder of the different facility and level definitions we can use in syslog.conf : Table 10-2. syslogd Facility and Level Definitions | Facility | Description | Level | Description | | kern | Messages generated by the kernel | emerg | A panic situation; this level of message | | user | Messages generated by random user processes | alert | A situation that should be corrected quickly | | mail | The mail system | crit | Critical errors such as disk drive failures | | daemon | System daemons such as networking daemons | err | General errors | | auth | The authentication subsystem, e.g., login, su, etc. | warning | Warning messages | | syslog | Internal messages generated by syslogd | notice | Not an error, but worth taking notice of | | lpr | The spooler | info | Information message | | news | The news system | debug | Information usually only seen when debugging programs | | uucp | The UUCP system | | | | cron | Message from the cron daemon | | | | local0 | Reserved for local use, e.g., user applications | | |
Most networking daemons use the daemon facility . If we are going to store networking- related messages into a separate file, the first thing we need to do is to decide at what level we want to start capturing data. As we are capturing information from daemons such as telnetd , inetd , ftpd , remshd , it might be appropriate to capture everything above the info level . It is this pairing of a facility and a level that syslog uses to decide what to do with messages. We have decided to send all message from the daemon facility at a level of info and above to a separate logfile. Here are the changes we need to make to syslogd 's configuration file /etc/syslog.conf :
root@hpeos003[] vi /etc/syslog.conf # @(#)B.11.11_LR # # syslogd configuration file. # # See syslogd(1M) for information about the format of this file. # mail.debug /var/adm/syslog/mail.log daemon.info /var/adm/syslog/netdaemon.log *.info;mail.none; daemon.none /var/adm/syslog/syslog.log *.alert /dev/console *.alert root *.emerg * root@hpeos003[]
The first highlighted line defines what to do with messages coming from the daemon facility at the info level and above. The last part of the line defines what to do with the messages. The destination for a message can either be of the following: -
A filename, beginning with a slash (it must be a fully qualified filename). -
A hostname prefixed by the @ symbol. Messages will be directed to the syslogd process on the name host, which can decide what to do with the messages depending on how the syslogd.conf file has been configured. Try to avoid creating a syslogd network loop where messages are sent from host to host to host in a continuous loop. It's not too clever. -
A comma-separated list of users who will receive a message on their console. -
An asterisk means every user currently logged in will receive a message on the terminal. Use of user names and an asterisk should be limited to important messages. A filename tells syslogd the name of the file (to open in append mode) we want to use. We don't need to create this file; syslogd will create it when we signal syslogd to reread its configuration file. The second highlighted line is as important as this entry that cancels (a level of none ) all daemon messages going to the syslog.log file. Without this daemon , messages would go to syslog.log as well (notice the facility is set to * , which means all facilities ). All that's left to do is to send the running syslogd process an HUP signal:
root@hpeos003[] kill -HUP $(cat /var/run/syslog.pid) root@hpeos003[] cd /var/adm/syslog root@hpeos003[syslog] ll *log -rw-r--r-- 1 root root 7114 Nov 17 16:27 OLDsyslog.log -r--r--r-- 1 root root 189454 Nov 17 16:51 mail.log -r--r--r-- 1 root root Nov 17 21:58 netdaemon.log -rw-r--r-- 1 root root 6077 Nov 17 21:58 syslog.log root@hpeos003[syslog] date Mon Nov 17 21:58:46 GMT 2003 root@hpeos003[syslog]
As you can see, syslogd has created my new logfile. All my networking daemons should now have info messages (and above) directed to this new logfile. I just telnet to myself to test it out ( assuming that inetd logging has been enabled):
root@hpeos003[syslog] telnet localhost Trying... Connected to localhost Escape character is '^]'. Local flow control on Telnet TERMINAL-SPEED option ON HP-UX hpeos003 B.11.11 U 9000/800 (ta) login: root Password: Please wait...checking for disk quotas (c)Copyright 1983-2000 Hewlett-Packard Co., All Rights Reserved. (c)Copyright 1979, 1980, 1983, 1985-1993 The Regents of the Univ. of California ... Value of TERM has been set to "dtterm". WARNING: YOU ARE SUPERUSER !! root@hpeos003[] ll /var/adm/syslog/netdaemon.log -r--r--r-- 1 root root 116 Nov 17 22:03 /var/adm/syslog/netdaemon.log root@hpeos003[] cat /var/adm/syslog/netdaemon.log Nov 17 22:03:14 hpeos003 inetd[4003]: telnet/tcp: Connection from localhost (127.0.0.1) at  Mon Nov 17 22:03:14 2003 root@hpeos003[] Mon Nov 17 22:03:14 2003 root@hpeos003[]
That seems to be working fine. If we want to utilize syslog messaging to notify and store certain events from our applications, we can use the logger command to send a message, at a given priority to the syslogd daemon:
root@hpeos003[] logger -t FINANCE -p daemon.crit "Finance Database Corrupt" root@hpeos003[] tail /var/adm/syslog/netdaemon.log ... Nov 18 00:43:31 hpeos003 FINANCE: Finance Database Corrupt root@hpeos003[]
One last thing. If you have to place a software call with your local Response Center, inform them that you have moved the daemon syslog entries to a different file. Otherwise, it just gets confusing as an engineer to have a whole chunk of information missing from syslog.log . 10.2.1.1 MANAGING SYSLOG LOGFILES Every time the system is rebooted, the startup sequence for syslog (/sbin/init.d/syslogd ) will rename the old syslog.log file to OLDsyslog.log . We need to decide what to do with the logfile we have just created. It is probably a good idea that we manage the logfile in a similar way to syslog , in other words, keep a copy of the logfile every time the system reboots. I suggest that you not change the /sbin/init.d/syslogd file because this file may change anytime you apply a patch or an operating system update. We could add an additional startup routine into /sinb/rc2.d . syslog uses the sequence number of S220 (currently). We could add a startup script jus after that, possibly S225 . Here are my guidelines for writing a script to manage any new logfiles created by syslog . -
Keep a copy of the current logfile. -
Zero-length the current logfile by using the shell " > " operator. -
Send syslogd an HUP signal to ensure that the daemon reads any changes to its configuration file. -
Do not use the rm command to delete the logfile once syslogd is running. The syslogd daemon will have the inode for the file open. Deleting the file simply removes the filename from the directory, and syslogd continues to write to disk blocks in the filesystem. As you don't have a filename anymore, you will not be able to read any of these messages. To rectify this, send syslogd an HUP signal (this will release the filesystem blocks for the deleted file). 10.2.2 The Event Monitoring System (EMS) Trying to keep our systems up and running is a difficult enough task without hardware failing on us with no warning. EMS gives us the ability to set up hardware monitors that continuously check the status of numerous hardware components. Certain thresholds we set will determine how EMS views an event . An event is some form of unusual activity for the monitored device to experience, e.g., a SCSI reset on a disk drive. EMS uses a series of monitor daemons that keep track of the status of various resources. The current list of monitors can be found in the EMS dictionary (a series of descriptive files in the /etc/opt/resmon/dictionary directory). The .dict files in this directory describe the various monitors currently available, including the pathname to the monitoring daemon itself, as well as any command line arguments that you want to pass to it. The daemons will monitor a whole range of resources. Resources are organized into a structure similar to a filesystem in order to group resources together. We can navigate around this resource hierarchy using the resls command. Whenever we want to send a request to a monitor daemon, a registrar process will communicate between the user interface and the relevant monitor daemon. When a monitor detects an event, it will send an appropriate message to a particular destination using a configured delivery method. This could be an email message to a user, a message written on the system console, syslog , or even an SNMP trap sent to an OpenView Network Node Manager machine. An additional part of EMS is something called the Peripheral Status Monitor ( PSM ) . Whenever an event occurs, an EMS monitor will detect the event and report it accordingly . The hardware monitor has no memory as such; it simply reports the event and goes back to monitoring. To the hardware monitor, the event is temporary in that it happens, it gets reported , it moves on. For utilities such as Serviceguard, this is not enough. Serviceguard needs to know the hardware status of a resource; it wants to know whether the LAN card is up or down . Hardware status monitoring is an extension to Hardware event monitoring. It is the job of the Peripheral Status Monitor ( psmctd and psmmon daemons) to notify EMS of the change of state of a resource. The hardware monitor will pass on an event to the Peripheral Status Monitor, which will convert the severity of the event into a device status . This will be passed to EMS, which will pass this information on to applications such as Serviceguard. From the hardware status, Serviceguard can take any appropriate actions such as moving an application package to another (adoptive) node. Last, we have EMS HA Monitors. These are additional EMS resources that have their own monitor processes over and above the basic hardware monitors. These monitors are designed to assist High Availability applications such as Serviceguard to understand the overall state of a system. EMS HA Monitors go beyond the basic hardware monitors provided by EMS on its own. Examples of EMS HA Monitors include how full particular filesystems are and the status of certain kernel parameters. EMS HA Monitors can be configured to send notification messages in the same way as basic hardware monitors and can interface with the Peripheral Status Monitor in order to maintain the state of a resource. This is the basic framework EMS operates in. EMS is installed as part of the Support Tools Manager online diagnostics product ( Supp-Tool-Mgr ). The most recent version is supplied with the quarterly published Support Plus CD/DVD, or it can be downloaded from the Web site http://software.hp.com/SUPPORTPLUS. Events have a Criteria Threshold (known as a severity ) assigned to them by the monitors themselves . The application developer who designed and wrote the monitor defines the Criteria Threshold for each event. In some ways, the Criteria Threshold can be thought of as similar in principle to a syslog priority . We can use the Criteria Threshold to decide where to send a message. There are five Criteria Thresholds with which a message can be tagged: By default, EMS will send messages to three main destinations: -
Most hardware monitors that produce an event with a severity greater than or equal of MAJOR WARNING are sent to syslog via an email to the root user. -
Events with a severity greater than or equal to INORMATION are sent to the text file /var/opt/resmon/log/event.log . The interface to managing basic hardware monitors is the menu interface /etc/opt/resmon/lbin/monconfig . Before using monconfig , it is worthwhile to navigate around the Resource Hierarchy using the resls command. The resls command allows you to navigate through the entire resource hierarchy, so we may find resources that are part of the EMS HA Monitor package and can't be managed via monconfig . Here's an example:
root@hpeos003[] resls / Contacting Registrar on hpeos003 NAME: / DESCRIPTION: This is the top level of the Resource Dictionary TYPE: / is a Resource Class. There are 7 resources configured below /: Resource Class /system /StorageAreaNetwork /adapters /connectivity /cluster /storage /net root@hpeos003[] resls /system Contacting Registrar on hpeos003 NAME: /system DESCRIPTION: System Resources TYPE: /system is a Resource Class. There are 9 resources configured below /system: Resource Class /system/jobQueue1Min /system/kernel_resource /system/numUsers /system/jobQueue5Min /system/filesystem /system/events /system/jobQueue15Min /system/kernel_parameters /system/status root@hpeos003[]
We can see that resls has found a number of resource classes, one being called system . Under this resource class, you'll find resource classes such as filesystem , events , and kernel_parameters . There is no way to tell from here which are basic hardware monitors and which are HA Monitors. The only way to find out is to use the monconfig command. Before we look at monconfig , a quick word on the resls command. While we are getting used to the extent of our resource hierarchy, we will have to persevere with resls in that it doesn't have a recursive option whereby you can get the command to list every resource in every resource class. Here's the monconfig command:
root@hpeos003[] /etc/opt/resmon/lbin/monconfig ============================================================================ =================== Event Monitoring Service =================== =================== Monitoring Request Manager =================== ============================================================================ EVENT MONITORING IS CURRENTLY ENABLED. EMS Version : A.03.20.01 STM Version : A.42.00 ============================================================================ ============== Monitoring Request Manager Main Menu ============== ============================================================================ Note: Monitoring requests let you specify the events for monitors to report and the notification methods to use. Select: (S)how monitoring requests configured via monconfig (C)heck detailed monitoring status (L)ist descriptions of available monitors (A)dd a monitoring request (D)elete a monitoring request (M)odify an existing monitoring request (E)nable Monitoring (K)ill (disable) monitoring (H)elp (Q)uit Enter selection: [s]
This is the main menu for managing the basic hardware monitors. We can add, modify, and delete monitors and what type of notification they will use. You need to know which monitor you are interested in before navigating through the screens. I will cut down much of the screen output in order to show you how to set up a basic hardware monitor:
Enter selection: [s] a ... 20) /storage/events/disk_arrays/High_Availability 21) /system/events/cpu/lpmc 22) /adapters/events/scsi123_em 23) /system/events/system_status Enter monitor numbers separated by commas {or (A)ll monitors, (Q)uit, (H)elp} [a] 21 Criteria Thresholds: 1) INFORMATION 2) MINOR WARNING 3) MAJOR WARNING 4) SERIOUS 5) CRITICAL Enter selection {or (Q)uit,(H)elp} [4] 1 Criteria Operator: 1) < 2) <= 3) > 4) >= 5) = 6) != Enter selection {or (Q)uit,(H)elp} [4] 4 Notification Method: 1) UDP 2) TCP 3) SNMP 4) TEXTLOG 5) SYSLOG 6) EMAIL 7) CONSOLE Enter selection {or (Q)uit,(H)elp} [6] 7 User Comment: (C)lear (A)dd Enter selection {or (Q)uit,(H)elp} [c] a Enter comment: [] Information : LPMC Reported Client Configuration File: (C)lear (A)dd Use Clear to use the default file. Enter selection {or (Q)uit,(H)elp} [c] c New entry: Send events generated by monitors /system/events/cpu/lpmc with severity >= INFORMATION to CONSOLE with comment: Information : LPMC Reported Are you sure you want to keep these changes? {(Y)es,(N)o,(H)elp} [n] y Changes will take effect when the diagmond(1M) daemon discovers that monitoring requests have been modified. Use the 'c' command to wait for changes to take effect. ============================================================================ ============== Monitoring Request Manager Main Menu ============== ============================================================================ Note: Monitoring requests let you specify the events for monitors to report and the notification methods to use. Select: (S)how monitoring requests configured via monconfig (C)heck detailed monitoring status (L)ist descriptions of available monitors (A)dd a monitoring request (D)elete a monitoring request (M)odify an existing monitoring request (E)nable Monitoring (K)ill (disable) monitoring (H)elp (Q)uit Enter selection: [s]
In this example, I have set up a monitor such that any messages greater than or equal to the INFORMATION severity for the /system/events/cpu/lpmc resource will be sent to the system console with a comment " Information: LPMC Reported ". The interface for managing PSM and HA Monitors is SAM. SAM will run the EMS GUI, allowing us to set up notifications for additional EMS monitors. From SAM's Main Menu, we navigate to Resource Management-Event Monitoring System. From the main screen, I can Add Monitoring Request (under the Actions menu item) for a resource, answering similar questions as the questions posed by monconfig (see Figure 10-3): Figure 10-3. Navigating through SAM to set up an EMS monitor. 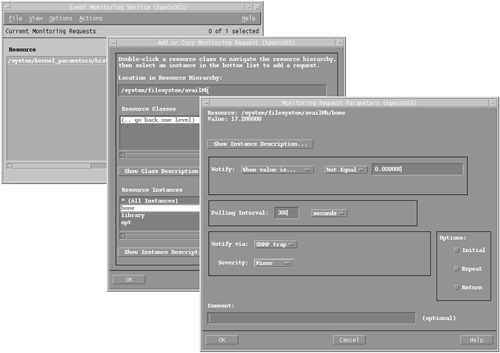
I don't need to tell you how to navigate through SAM. One option to watch is the Options on the lower-right side of the screen. These options will determine additional conditions when you will be notified, i.e., Initial = the initial time the condition is met, Repeat = every time the condition is met, and Return = when the condition is no longer met. You can choose multiple Options. You may be able to see in Figure 10-3 that there appear to be some EMS monitors already set up on this system. If you install the kcweb utility, it can be configured to use EMS monitors to track the historical behavior of kernel parameters. 10.2.3 Support Tools Manager (STM) Support Tools Manager (STM) is a series of offline and online diagnostics allowing you to perform a number of tests on hardware components. STM also comes with a number of diagnostic monitoring daemons that will record activity coming from hardware components. The vast majority of the STM functionality is password protected, as many of the diagnostic tests are destructive, e.g., to read/write test on disk drives . The only time we get involved with STM diagnostics is when we suspect that we may have a hardware error with a particular component, e.g., memory, CPU, or a disk. By running an information test on a component, we can gather any errors trapped by the component. In addition, we can look at diagnostic logfiles maintained by the diagnostic daemons to help us glean any further information regarding the behavior of our system. It should be noted that we are not trying to make you into a hardware engineer. This information will assist you in putting together a picture of what might be happening on your system. If you suspect that you have a hardware problem on your system, you should contact your local Response Center for further assistance. We look at some features of STM that can give us insight into some other hardware monitoring that takes place on our system. The Support Tools Manager (STM) is installed from the quarterly Support Plus CD/DVD, or it is available from the web site http://software.hp.com/SUPPORTPLUS. The STM diagnostic daemons constantly monitor system hardware for any activity. Whenever something is reported to the daemon, it simply records the information in a diagnostic logfile under the directory /var/stm/logs . The primary logging daemon diaglogd will maintain a series of binary logfiles under the /var/stm/logs/os/ directory. If we have lots of hardware errors, the logfiles in this directory will grow considerably. We have STM commands whereby we can manage these logfiles. Other daemons include memlogd that monitors for memory errors and cclogd that monitors and records Chassis Logs. Chassis logs are log records generated by various system hardware, software, and firmware. The overall diagnostic management daemon is the diagmond . Each daemon has a man page if you require any more information. We look at how to read the various logfiles created by these daemons. There are three interfaces to STM: a GUI ( xstm ), a MUI ( mstm ), and a CLUI ( cstm ). To make capturing screen output easier, I use the command-line user interface, cstm . The job of looking at logfiles in STM is under the banner of running an STM utility ( ru command) . From there, we select the most recent raw logfile ( sr command), format the raw logfile ( fr command), and then display the formatted logfile ( fl command). This detailed report we can save to a disk file for further analysis. Here goes: root@hpeos003[] cstm Running Command File (/usr/sbin/stm/ui/config/.stmrc). -- Information -- Support Tools Manager Version A.42.00 Product Number B4708AA (C) Copyright Hewlett Packard Co. 1995-2002 All Rights Reserved Use of this program is subject to the licensing restrictions described in "Help-->On Version". HP shall not be liable for any damages resulting from misuse or unauthorized use of this program. cstm> ru -- Run Utility -- Select Utility 1 MOutil 2 logtool Enter selection : 2 -- Logtool Utility -- To View a Summary of Events in a Raw Log 1. Select a raw (unformatted) log file. (File Menu -> "Select Raw") The current log file ends in ".cur", e.g., "log1.raw.cur". You do not have to switch logs. 2. View the summary of the selected log file. (View Menu -> "Raw Summary") To Format a Raw Log 1. Set the format filter for the types of entries you want to see. (Filters Menu -> "Format"). To see all entries, skip this step. 2. Format the raw log file. (File Menu -> "Format Raw") 3. Display the formatted file. (View Menu -> "Formatted Log") 4. To further narrow the entries displayed, set a display filter. (Filters Menu -> "Display" -> "Formatted") For more information, use the on-line help (Help Menu -> "General help"). Logtool Utility> sr -- Logtool Utility: Select Raw Log File -- Select a raw log file or files to view, format or filter. [/var/stm/logs/os/log2.raw.cur] Path: /var/stm/logs/os/ File Name: log2.raw.cur -- Converting a (784) byte raw log file to text. -- Preparing the Logtool Utility: View Raw Summary File ... .... hpeos003 : 192.168.0.65 .... -- Logtool Utility: View Raw Summary -- Summary of: /var/stm/logs/os/log2.raw.cur Date/time of first entry: Wed Nov 12 22:38:32 2003 Date/time of last entry: Wed Nov 12 22:38:32 2003 Number of LPMC entries: 0 Number of System Overtemp entries: 0 Number of LVM entries: 0 Number of Logger Event entries: 1 Number of I/O Error entries: 32 Device paths for which entries exist: (32) 0/0/1/0.4.0 -- Logtool Utility: View Raw Summary -- View - To View the file. Print - To Print the file. SaveAs - To Save the file. Enter Done, Help, Print, SaveAs, or View: [Done] <cr> Select Raw processing file /var/stm/logs/os/log2.raw.cur Number of entries analyzed is 1. Number of entries analyzed is 33. The Select Raw operation completed. The Display Raw Summary operation is currently in progress. Display of the raw log file summary was successful. Logtool Utility> fr -- Logtool Utility: Format Raw Log File -- Select a directory into which to place the formatted file: Directory: [/var/stm/logs/os/] The Format Raw operation is currently in progress. Entries processed is 1 of 33 total entries; entries formatted is 1. Entries processed is 33 of 33 total entries; entries formatted is 33. The Format Raw operation completed successfully. The following raw log file(s) were formatted into /var/stm/logs/os/log2.fmt4: /var/stm/logs/os/log2.raw.cur The Display Formatted Summary operation is currently in progress. -- Converting a (1116) byte raw log file to text. -- Preparing the Logtool Utility: View Formatted Summary File ... .... hpeos003 : 192.168.0.65 .... -- Logtool Utility: View Formatted Summary -- Summary of: /var/stm/logs/os/log2.fmt4 Formatted from: /var/stm/logs/os/log2.raw.cur Date/time of first entry: Wed Nov 12 22:38:32 2003 Date/time of last entry: Wed Nov 12 22:38:32 2003 Number of LPMC entries: 0 Number of System Overtemp entries: 0 Number of LVM entries: 0 Number of Logger Event entries: 1 Number of I/O Error entries: 32 Device paths for which entries exist: -- Logtool Utility: View Formatted Summary -- View - To View the file. Print - To Print the file. SaveAs - To Save the file. Enter Done, Help, Print, SaveAs, or View: [Done] <cr> Display of the formatted log file summary was successful. Logtool Utility> fl The Display Formatted Log operation is currently in progress. -- Converting a (100176) byte raw log file to text. -- Preparing the Logtool Utility: View Formatted Log File ... .... hpeos003 : 192.168.0.65 .... -- Logtool Utility: View Formatted Log -- Formatted Output of: /var/stm/logs/os/log2.fmt6 Formatted from: /var/stm/logs/os/log2.raw.cur Date/time of first entry: Wed Nov 12 22:38:32 2003 Date/time of last entry: Wed Nov 12 22:38:32 2003 Display Filters: Starting Date: Wed Nov 12 22:38:32 2003 Ending Date: Wed Nov 12 22:38:32 2003 =-+-=-+-=-+-=-+-=-+-=-+-=-+-=-+-=-+-=-+-=-+-=-+-=-+-=-+-=-+-=-+-=-+-=-+-=-+-= Entry Type: I/O Error -- Logtool Utility: View Formatted Log -- View - To View the file. Print - To Print the file. SaveAs - To Save the file. Enter Done, Help, Print, SaveAs, or View: [Done] SA -- Save Logtool Utility: View Formatted Log -- Logtool Utility: View Formatted Log File Path: / File Name: /tmp/logtool.18Nov03 Enter Done, Help, Print, SaveAs, or View: [Done] Display of the formatted log file was successful. Logtool Utility> If I exit all the way out of cstm , I can view the formatted logfile just created:
root@hpeos003[] more /tmp/logtool.18Nov03 .... hpeos003 : 192.168.0.65 .... -- Logtool Utility: View Formatted Log -- Formatted Output of: /var/stm/logs/os/log2.fmt6 Formatted from: /var/stm/logs/os/log2.raw.cur Date/time of first entry: Wed Nov 12 22:38:32 2003 Date/time of last entry: Wed Nov 12 22:38:32 2003 Display Filters: Starting Date: Wed Nov 12 22:38:32 2003 Ending Date: Wed Nov 12 22:38:32 2003 =-+-=-+-=-+-=-+-=-+-=-+-=-+-=-+-=-+-=-+-=-+-=-+-=-+-=-+-=-+-=-+-=-+-=-+-=-+-= Entry Type: I/O Error Entry logged on Wed Nov 12 22:38:32 2003 Entry id: 0x3fb2b66800000011 Device Path: 0/0/1/0.4.0 Product: SCSI Disk Product Qualifier: HP73.4GST373307LC Logger: sdisk Device Type: Disk Device Qualifier: Hard --------------------------------------------------------------------------- Description of Error: The device was not ready to process requests, initialization is required. This I/O request and all subsequent I/O requests directed to this device will not be processed. Probable Cause / Recommended Action: The device may have been powered off and may be being powered on. ... root@hpeos003[]
As you can imagine, this file can be some considerable size on a system that is having numerous hardware problems. Within the Logtool Utility, you can use the SwitchLog ( sl ) command to switch to a new raw logfile, allowing you to archive the current raw logfile. Other logfiles we can look at from within Logtool include the memory logfile. We use the vd (view detail) command and save the output to a logfile: Logtool Utility> vd Formatting of the memory error log is in progress. -- Converting a (208) byte raw log file to text. -- Preparing the Logtool Utility: View Memory Report File ... .... hpeos003 : 192.168.0.65 .... -- Logtool Utility: View Memory Report -- System Start Time Thu Jan 1 00:00:00 1970 Last Error Check Time Tue Nov 18 02:36:30 2003 Logging Time Interval 3600 NOTE: There are no error entries in the Memory Log file. -- Logtool Utility: View Memory Report -- View - To View the file. Print - To Print the file. SaveAs - To Save the file. Enter Done, Help, Print, SaveAs, or View: [Done] SA -- Save Logtool Utility: View Memory Report -- Logtool Utility: View Memory Report File Path: / File Name: /tmp/memlog.18Nov03 Enter Done, Help, Print, SaveAs, or View: [Done] Display of the Memory Report Log with all memory errors was successful. Logtool Utility> Similarly for the Chassis logs, we can look at the Chassis Boot logs ( cb command) and the Chassis Error logs ( ce command), and save the output to a text file. You can explore these commands yourself. The other important task we can perform with STM is to run an information diagnostic on a hardware component. Lots of components will record information such as errors or status information; processors store a previous tombstone in the Processor Information Module (PIM), memory records any pages deallocated in the Page Deallocation Table (PDT), and disks record the number of recoverable and unrecoverable errors. In a similar manner to Logtool, once we have run the information diagnostic, we can store the output to a text file. When we first run cstm , we need to display a map of all the devices in the system ( map command). We can then select an individual device ( sel dev <device number> command) or select an entire class of device ( sc command). Once we have selected the device(s), we run the information diagnostic ( info command) and then display the information diagnostic logfile ( infolog command). Let's look at an example of performing an information diagnostic on memory:
root@hpeos003[] cstm Running Command File (/usr/sbin/stm/ui/config/.stmrc). -- Information -- Support Tools Manager Version A.42.00 Product Number B4708AA (C) Copyright Hewlett Packard Co. 1995-2002 All Rights Reserved Use of this program is subject to the licensing restrictions described in "Help-->On Version". HP shall not be liable for any damages resulting from misuse or unauthorized use of this program. cstm> map hpeos003 Dev Last Last Op Num Path Product Active Tool Status === ==================== ======================= =========== ============= 1 system system () 2 0 Bus Adapter (582) 3 0/0 PCI Bus Adapter (782) 4 0/0/0/0 Core PCI 100BT Interface 5 0/0/1/0 PCI SCSI Interface (10000 6 0/0/1/1 PCI SCSI Interface (10000 7 0/0/1/1.15.0 SCSI Disk (HP36.4GST33675 8 0/0/2/0 PCI SCSI Interface (10000 9 0/0/2/0.2.0 SCSI Disk (TOSHIBACD-ROM) 10 0/0/2/1 PCI SCSI Interface (10000 11 0/0/2/1.15.0 SCSI Disk (HP36.4GST33675 12 0/0/4/1 RS-232 Interface (103c104 13 0/2 PCI Bus Adapter (782) 14 0/2/0/0 PCI Bus Adapter (8086b154 15 0/2/0/0/4/0 PCI 4 Port 100BT LAN (101 16 0/2/0/0/5/0 PCI 4 Port 100BT LAN (101 17 0/2/0/0/6/0 PCI 4 Port 100BT LAN (101 18 0/2/0/0/7/0 PCI 4 Port 100BT LAN (101 19 0/4 PCI Bus Adapter (782) 20 0/4/0/0 Fibre Channel Interface ( 21 0/6 PCI Bus Adapter (782) 22 0/6/0/0 PCI SCSI Interface (10000 23 0/6/0/1 PCI SCSI Interface (10000 24 0/6/2/0 Fibre Channel Interface ( 25 8 MEMORY (9b) 26 160 CPU (5e3) cstm> cstm> sel dev 25 cstm> info -- Updating Map -- Updating Map... cstm> infolog -- Converting a (1196) byte raw log file to text. -- Preparing the Information Tool Log for MEMORY on path 8 File ... .... hpeos003 : 192.168.0.65 .... -- Information Tool Log for MEMORY on path 8 -- Log creation time: Tue Nov 18 03:34:50 2003 Hardware path: 8 Basic Memory Description Module Type: MEMORY Total Configured Memory : 1024 MB Page Size: 4096 Bytes Memory interleaving is supported on this machine and is ON. Memory Board Inventory DIMM Slot Size (MB) --------- --------- 01 512 02 512 --------- --------- System Total (MB): 1024 Memory Error Log Summary The memory error log is empty. Page Deallocation Table (PDT) PDT Entries Used: 0 PDT Entries Free: 50 PDT Total Size: 50 -- Information Tool Log for MEMORY on path 8 -- View - To View the file. Print - To Print the file. SaveAs - To Save the file. Enter Done, Help, Print, SaveAs, or View: [Done] SA -- Save Information Tool Log for MEMORY on path 8 -- Information Tool Log for MEMORY on path 8 File Path: / File Name: /tmp/info.mem.18Nov03 Enter Done, Help, Print, SaveAs, or View: [Done] cstm> cstm> exit -- Exit the Support Tool Manager -- Are you sure you want to exit the Support Tool Manager? Enter Cancel, Help, or OK: [OK] root@hpeos003[]
If we were working with our local Response Center, we could pass this information on to a qualified hardware engineer to help him diagnose any potential problems. The problem we may be investigating may be the result of a system crash. In Chapter 9, we discussed how the system stores a crashdump to disk and the savecrash process. We now look at the process of trying to work out whether the problem was related to a hardware or software problem. With this information, we can log an appropriate call with our local Response Center, which is responsible for conducting root cause analysis. |