14.5 STATECHART DIAGRAM
|
14.5 STATECHART DIAGRAM
Statechart diagrams are best for displaying the different states that an object can get into across several use cases. In that sense, they help to give a better understanding of the lifetime behavior of a single object in an OO program. Shown in Figure 14.16 is a statechart diagram for the Buyer object in our internet auction example. The rounded rectangles show the different states of the Buyer object. The name of the state is shown as the topmost entry in bold in a rounded rectangle. If there is additional information inside the rectangle, it is separated from the name by a line. An entry preceded by "do/" denotes an activity in that state.
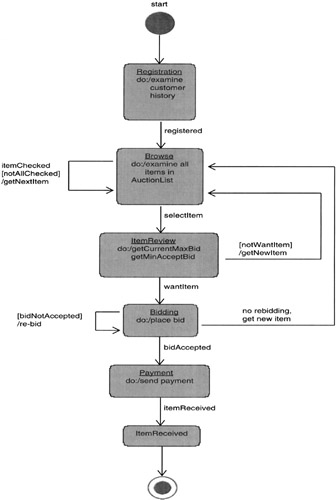
Figure 14.16
The paths with arrowheads show how an object transitions from state to state. The syntax of the state transition labels is
Event[Guard]/Action
all three parts of which are optional. What this syntax means is that the occurrence of the Event will cause this state transition provided the Guard condition evaluates to TRUE. However, before the actual transition to the new state takes place, Action must be executed. Since at any time only one transition can be taken out of a state, the guards on all the outgoing transition paths from a given state must be mutually exclusive.
When a Buyer object is first created, it is in the Registration state attached to the Start state at the top.[1] From that state it has only one transition, labeled
registered
to the Browse state. Evidently, this transition label only has the event part specified. Once in the Browse state, the object engages in the activity "examine all items in AuctionList." As the Buyer object goes through each item, the event itemChecked takes place, which causes the guard condition on the transition-to-self arc to be evaluated. As long as the Buyer does not select an item for actual bidding, the Buyer object will continue to stay in the Browse state. However, when the event selectItem takes place, the Buyer object will transition to ItemReview state.
In the ItemReview state, the Buyer object examines the currentMaxBid placed on the item by some other Buyer and the minAcceptBid specified by the Seller object. Depending on what it would take to place a meaningful bid on the item, the Buyer object could transition to the Bidding state or back to the Browse state. The rest of the statechart diagram should be self explanatory.
Each state shown in the figure, except the ItemReceived state, actually has one more outgoing transition that is not shown-this would be a transition to a state called TerminateSession. Since it should be possible to terminate the interaction with the auction server at any time during the lifetime of the Buyer object, from all the other states there should be a transition arc to a state called TerminateSession triggered by an event that could be called "terminateSession." Since such transition arcs are likely to visually clutter up a statechart diagram, an alternative consists of grouping all the states together that have a transition to a common target state. The grouped states can be called a superstate; one can then have a single transition from the superstate to the target state, as shown in Figure 14.17.
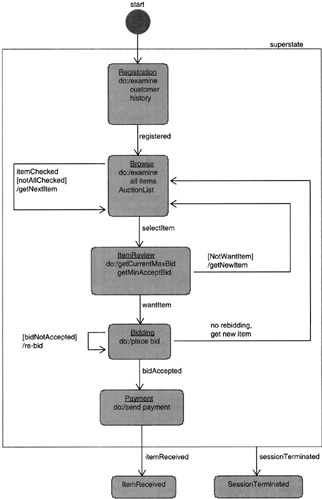
Figure 14.17
The statechart diagram of Figure 14.17 shows the various states of a Buyer object for a closely related set of use cases that the object would be involved in. A Buyer object would also be involved in use cases that deal with a check of his/her past record as an auction site participant, his/her creditworthiness, and so on, before the acceptance of the bid. One could conceive of the statechart diagram of Figure 14.18 that would show these other activities related to a Buyer object.
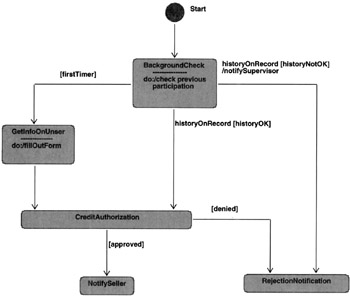
Figure 14.18
In a modern implementation, it is likely that the computations represented by the two previous statechart diagrams would be executed in two separate threads. In this way, the background check and credit authorization could proceed in parallel with the Buyer's interaction for placing a bid. This would, of course, imply that a Buyer object may simultaneously be in two states, one from the statechart diagram of Figure 14.17 and the other from the statechart diagram of Figure 14.18.
If we want to show the combined behavior of a Buyer object that would correspond to these two separate but concurrently running statechart diagrams, we can combine the two diagrams into what' called a concurrent statechart diagram, shown at a coarse level in Figure 14.19. The concurrent section of the statechart diagram is shown inside the large box with two partitions, one corresponding to each thread. As mentioned before, a Buyer object will be able to be simultaneously in two states, one from each partition. Outside the concurrent section, the Buyer object will be allowed to be in only one state at any one time. For our example, that means that the Buyer object could be simultaneously in, say, the ItemReview and the BackgroundCheck states. But at any one time it can only be either the SessionTerminated state, or the ItemReceived state, or the RejectionNotification state.
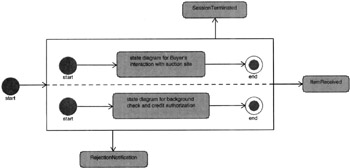
Figure 14.19
[1]The Start state itself, shown as a filled black circle, is a dummy state that gets the action started. The final or the end state, represented by a filled black circle inside another circle, is also a dummy state. The statechart diagram of Figure 14.19 includes a couple of end states.
|
EAN: 2147483647
Pages: 273