Performance Monitor
Windows NT Performance Monitor tends to be an underappreciated utility—generally because administrators haven't taken the time to learn how to use it effectively. With a product such as SMS 2.0, which requires significant resources to function efficiently, Performance Monitor can be one of the most effective tools at your disposal for identifying server resource usage and load. Let's approach this discussion, therefore, with two objectives: to reintroduce the Performance Monitor tool and ensure that you understand how to navigate it, and to identify some Performance Monitor objects and counters that can be of specific use when you are monitoring resource usage and load on your site systems.
Using Performance Monitor
One of the more important tasks in troubleshooting problems on your server, whether it is a Windows NT server or an SMS site system, is to spot potential problem sources and develop and analyze trends before the problems materialize. Achieving this kind of analysis is a two-step process of baseline creation and real-time tracking. You should always create a baseline chart or log of "normal" activity on your server. In our case, this chart should include the objects and counters specific to SMS 2.0 server activity. When you are analyzing performance, you can create real-time charts using the same objects and counters you used for your baseline chart and then compare the real-time charts to the baseline to determine how server performance has been affected.
![]()
NOTE
Throughout this book, references to a Performance Monitor object and one of its counters will appear in the form Object:Counter. For example, the Processor object has several counters that you can chart, one of which is the % Total Processor Time counter. This object and counter set would be referred to as Processor:% Total Processor Time.
Windows NT initially includes about twenty Performance Monitor objects. These objects facilitate the monitoring of basic system resources, including memory, processor, disk, and network. You will want to monitor these four areas on any given Windows NT server, especially your SMS servers. In addition to these default objects, other objects and their corresponding counters are added when other applications—for example, SMS 2.0 or Microsoft SQL Server 7.0—are installed. These objects represent additional items that you can monitor to get more information about a specific resource situation.

TIP
Monitoring Object:Counter values alone without gathering any other object data to reference against is a futile exercise for the administrator—you cannot obtain any useful or specific information. For example, if the Processor:% Processor Time value is consistently higher than 80 percent, you might conclude that the processor is overutilized. However, you have no information as to what may be overutilizing the processor. To determine which process is causing the problem, you should track Process:% Processor Time for suspected processes. You will then have data connected to each suspected process, and you can base your analysis on this data comparison.
Baselines are also important in determining when a given system is being "resource-challenged." It should be obvious, but it bears repeating that unless you know what normal resource utilization is like on any given system, you cannot begin to analyze problems or bottlenecks, develop trends, or implement load balancing across systems.
Creating a Performance Monitor Chart
To create a Performance Monitor chart, follow these steps:
- Start Windows NT Performance Monitor.
- Choose Add To Chart from the Edit menu to display the Add To Chart dialog box, shown in Figure 6-1.
- Confirm the name of the system you are monitoring in the Computer text box. You can also click the Browse button to select from a list of systems, or type in the name of the system you want to monitor.
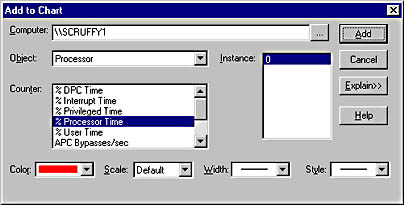
Figure 6-1. The Add To Chart dialog box.
TIP
Because running Performance Monitor on a Windows NT server requires additional resources in and of itself, you could remotely monitor your systems from your Windows NT workstation rather than at the actual system in question.
- Select an object, a counter, and an appropriate instance, if necessary.
- Specify the desired color, scale, width, and style for your chart lines.
- If you're unsure of the purpose or function of a counter, select it and click the Explain button to display a brief description at the bottom of the dialog box.
- Click Add to begin charting information for the objects you selected.
Figure 6-2 shows a representative chart. Here three Object:Counter sets are being monitored: Processor:% Processor Time, Process:% Processor Time for the SMS Executive instance (smsexec), and Memory:Pages/Sec. In this example, where the values were generated by updating the collection memberships in the SMS Administrator Console, the peaks in the chart show the point at which the update has taken place through activity monitored by the three counters. For detailed information about updating the collection memberships in the SMS Administrator Console, see Chapter 11.
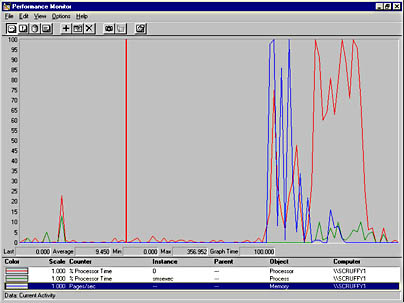
Figure 6-2. A simple chart that continually monitors three Object:Counter values.
TIP
The more objects monitored in a chart, the busier the chart becomes. To facilitate the reading of chart lines, turn on the highlight feature. With the chart open, press Ctrl-H or Backspace. Then when you select a line on the chart, it will be displayed as a heavy white line, making it easier to read. Press Ctrl-H or Backspace again to turn off the highlight feature.
SMS 2.0 performance, like that of most Windows NT systems, tends to revolve around a specific set of system resources that can be monitored and analyzed with the help of Performance Monitor. These resources include processor, disk, memory, and network. Table 6-1 outlines the more useful objects and counters for tracking and analyzing SMS site system server performance using Performance Monitor.
Table 6-1. Suggested Performance Monitor objects and counters
| Object:Counter | Description | Instance | Threshold Suggestions |
|---|---|---|---|
| Memory:Committed Bytes | Represents the amount of virtual memory that has been committed for use for paging RAM | N/A | This value should be less than the amount of physical RAM. The higher the value, the more likely that the system is experiencing a high level of paging and thrashing. |
| Memory:Page Reads/Sec | Represents the frequency at which data had to be read from the page file back into RAM to resolve page faults | N/A | A value less than or equal to 5 generally represents acceptable performance. Values over 5 may indicate a need for more RAM. |
| Network Segment:Total Bytes Received/Second | Represents the number of bytes received per second on this network segment | Each network card | This value should remain relatively consistent and reflect average network traffic being generated. Prolonged increases in this value may indicate that a process or server on the segment is generating additional traffic and using potentially more bandwidth. |
| Network Segment:Total Frames Received/Second | Represents the number of network frames received per second on this segment | Each network card | Same as the threshold suggestion for Network Segment:Total Bytes Received/Second. |
| Physical Disk:% Disk Time | Represents the amount of time the disk is engaged in servicing read and write requests | Each physical disk | Levels less than or equal to 80 percent generally represent acceptable system performance. |
| Physical Disk:Current Disk Queue Length | Represents the number of read and write requests currently waiting to be processed on the physical disk | Each physical disk | Subtract from this value the number of spindles on the disks. (A RAID device would have two or more spindles.) The resulting value should average less than 2. |
| Process:% Processor Time | Represents the percentage of time spent by the processor or processors executing threads for the process selected | Total, or for each process currently running | Use with Processor:% Processor Time to determine which SMS process in particular is utilizing processor time and to what extent. |
| Processor:% Processor Time | Represents the percentage of time spent by the processor or processors executing nonidle threads | Total, or for each installed processor | Levels less than or equal to 80 percent generally represent acceptable system performance. |
| SQL Server:Cache Hit Ratio | Represents how often SQL Server requests could be resolved from the SQL Server cache rather than having to query the database directly | N/A | This value should be veryhigh—98 percent or greater, which indicates efficient and responsive processing of SQL queries. |
| System:% Total Processor Time | Represents the average amount of productive time spent by all processors executing nonidle threads | N/A | Levels less than or equal to 80 percent generally represent acceptable system performance. Use this object while also monitoring the SMS Executive Thread States object. |
| System:Processor Queue Length | Represents the number of threads waiting to be processed | N/A | There should generally be no more than two requests waiting to be processed. Use this object while also monitoring the SMS Executive Thread States object. |
| Thread:Context Switches/Sec | Represents the number of context switches between threads; a thread switch might be caused by one thread requesting information from another or yielding to a higher priority thread | Total | The lower the value, the better. |
These and other Performance Monitor objects and counters are meant to be used together to determine overall system performance as well as limit problem processes and potential resource bottlenecks.
As mentioned, you cannot perform effective problem or trend analysis of a system if you do not have statistics relating to normal performance of that system. To get this baseline data, you should create chart information during periods of normal and peak performance and then save this information as Performance Monitor logs.
Creating a Performance Monitor Log
To create a Performance Monitor log, follow these steps:
- Start Windows NT Performance Monitor.
- Choose Log from the View menu to display the Performance Monitor Log window, shown in Figure 6-3.
- Choose Add To Log from the Edit menu to display the Add To Log dialog box, shown in Figure 6-4. This dialog box displays the name of the computer from which you will gather data and a list of objects whose data you can collect.
- Select each object for which you want to collect data and click Add. Click Done when you have finished to return to the Performance Monitor Log window.
- Choose Log from the Options menu to display the Log Options dialog box, shown in Figure 6-5.
- Enter a name for the log file, and specify the locations where you'd like to store the log. Change the update interval if you want.
- Click Start Log to return to the Performance Monitor Log window and begin collecting data. You can monitor the size of the log file in the File Size box.
- When you have collected the amount of data you need, choose Log from the Options menu once again, and click Stop Log in the Log Options dialog box.
- Choose Log from the Options menu one more time, and click Save in the Log Options dialog box to save the log file.
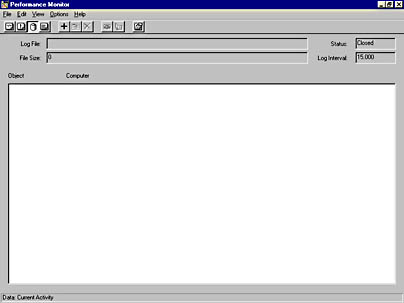
Figure 6-3. The Performance Monitor Log window.
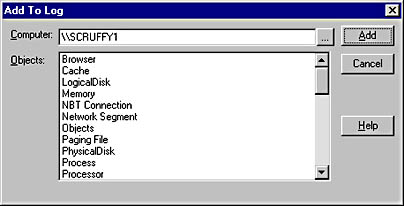
Figure 6-4. The Add To Log dialog box.
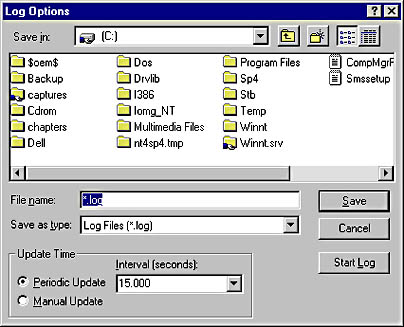
Figure 6-5. The Log Options dialog box.
Creating a Chart from a Log File
Unlike a typical chart, log files do not let you specify which counters to monitor for each object you add to the log. You do that when you create a chart from the collected log data. To create a chart using log file data, follow these steps:
- Start the Windows NT Performance Monitor.
- Choose Data From from the Options menu to display the Data From dialog box, shown in Figure 6-6.
- Enter the name of the log file you created and click OK to return to Performance Monitor.
- Choose Add To Chart from the Edit menu to display the Add To Chart dialog box, shown in Figure 6-1. The only objects that will be available are those you added to the log file. All the counters corresponding to those objects will be available. Build your chart just as before.
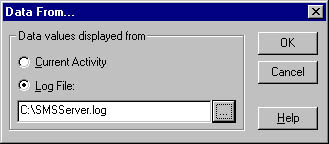
Figure 6-6. The Data From dialog box.
Figure 6-7 shows a chart created from a log file, which is a static chart. It represents values collected by the objects over a specific period of time. As with the chart shown in Figure 6-2, the values in this chart were generated by updating collection membership through the SMS Administrator Console.
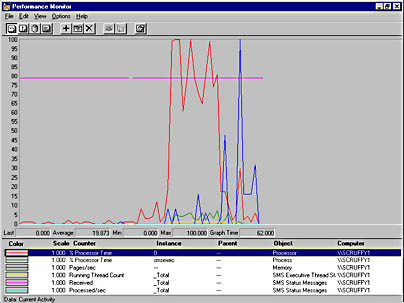
Figure 6-7. A sample static chart created from a log file.
You can compare this chart to a dynamic current chart on the same system to determine whether current activity falls within acceptable normal limits.
Specific Objects and Counters
When SMS 2.0 is installed, the Setup program adds a set of SMS-specific objects and counters to the Windows NT Performance Monitor that can be used to assess performance levels of your SMS site system. These objects and counters are available only when Performance Monitor is started on an SMS site server and the SMS Executive service is running on that site server. Table 6-2 describes these added objects and some of their more useful counters.
Table 6-2. SMS-specific Performance Monitor objects and counters
| Object | Counter | Description |
|---|---|---|
| SMS Discovery Data Manager | Total DDRs Processed | Total number of discovery data records (DDRs) processed by Discovery Data Manager during the current session. This value should generally be high when one or more discovery methods have been enabled. If this value is low, you may need to check the discovery process to determine whether it is processing normally. Refer to Chapter 7 for a discussion of the discovery process. |
| SMS Executive Thread States | Running Thread Count | When using the _Total instance, this value indicates the total number of SMS threads currently running. By examining specific instances, you can assess thread count on a per-thread basis. You can also monitor sleeping threads, which are blocked by the Yield function, and yielding threads, which are ready to run but not allowed to due to the need to limit running threads. |
| SMS In-Memory Queues | Total Objects Dequeued | Represents the total number of objects added to the queue by a specific component since the component last started. The number of objects can be monitored for each component by selecting the component in the instance list. |
| SMS Inventory Data Loader | Total MIFs Processed | Represents the total number of inventory records processed by Inventory Data Loader during the current session. You can also monitor the number of MIFs processed per minute during the monitoring session and the number of bad MIFs processed during the current session. |
| SMS Software Inventory Processor | Total SINVs Processed | Represents the total number of software inventory records (SINVs) processed by the Software Inventory Processor during the current session. You can also monitor the number of software inventory records processed per minute during the monitoring session and the number of bad records processed during the current session. |
| SMS Standard Sender | Average Bytes/Sec | Represents the average throughput of the sender. Generally, this value should be high since you want to process the greatest amount of information in the shortest amount of time. If the value is low, you might suspect network or card problems. You can also monitor total bytes attempted, failed, and sent in order to establish baselines for the sender. |
| SMS Standard Sender | Sending Thread Count | Represents the number of threads currently sending to a destination. You can monitor the total number of threads sent to all sites or monitor threads on a per-site basis by selecting the appropriate instance. |
| SMS Status Messages | Processed/Sec | Represents the number of status messages Status Message Manager has processed per second. Depending on the instance selected, you can monitor the total number of status messages processed or break down messages into those processed from the in-memory queue and from Status Manager's inbox. |
Some of these objects are informational, providing additional data to help you understand how a component is working. By and large, they all can assist you in establishing how resources are being utilized on your SMS servers. Remember, the idea here is to use these SMS-specific objects and counters along with the traditional objects and counters used to monitor processor, memory, disk, and network performance to establish a baseline of normal activity on your SMS servers. You then use that baseline to help you determine when performance is inside the norm and when it becomes unacceptable.
![]()
NOTE
By default, disk performance object counters are not enabled on Windows NT systems, reducing the number of resources monitored and the overhead needed to monitor them. If you create a chart using disk objects such as Logical Disk and Physical Disk, no data will be created until you enable disk counters. To do this, enter the following command at a Windows NT command prompt: DISKPERF -Y. You will need to restart the system in question before the disk counters are enabled. Enter DISKPERF -N to disable the disk counters when you have finished, again remembering to restart your system to make the change take effect.
![]()
MORE INFO
Performance Monitor contains many additional features and options. For a complete discussion of Performance Monitor, attend Microsoft Official Curriculum (MOC) 689 "Supporting Microsoft Windows NT 4.0 Server Enterprise Technologies" or refer to the Windows NT 4.0 Administrator's Guide in the Readme file for Windows NT 4.0.
EAN: 2147483647
Pages: 167