Load Funds and Costs
| We noted earlier in the chapter that more than 80 percent of fund purchases involve load funds, with investors giving up part of their initial investment as a sales charge. According to the statistics, the average front-end load fund has a 1.33 percent annual expense ratio, whereas the average no-load fund has a 1.09 percent annual expense ratio. [6] What difference might this make over a long period?
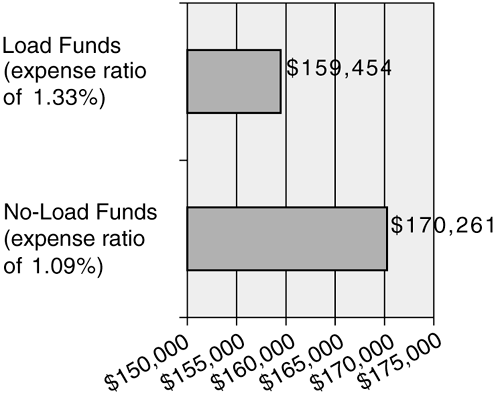
Let's use the previous example of $10,000 invested in either of two funds, one with an annual operating cost of 1.33 percent and the other with an annual operating cost of 1.09 percent. Each fund is assumed to earn 11 percent per year before expenses are deducted. Assume someone holds the investment for his or her working life of 30 years , and then cashes out. The difference in ending wealth, starting with $10,000 (shown in Figure 18-3), is almost $11,000. Figure 18-3. Ending Wealth for the Average Front-End Load Fund Versus the Average No-Load Fund, Each With a Different Annual Expense Ratio, for a 30-Year Period, Starting With $10,000 Invested in Each and Assuming an Annual 11 Percent Return Before Expenses Are Deducted. Now consider the time period analyzed in the performance discussion, the three-year period ending in July 2001. For this period, the S&P 500 was up a total of 9.6 percent, whereas the average diversified stock fund was up only 4.9 percent. Funds with an annual expense ratio of one percent or less gained 8.3 percent over that period, significantly better than the entire group of diversified stock funds, although still not as good as the market as a whole. Clearly, costs do matter. According to an exclusive annual survey by Bloomberg Personal Finance , "low-cost funds beat the returns of high-cost funds, on average, in every one of the 15 stock and bond categories we analyzed." [7] This survey analyzed expense ratios and performance for funds for the five-year period ending in 2000. Results include the following:
One of the big disappointments with mutual funds is that despite the great growth in total assets (to approximately $7 trillion), costs do not always decrease. Instead, they often increase. It would be reasonable to assume that greater economies of scale would be accompanied by greater efficiencies and savings for shareholders, but this does not automatically follow. The Lipper Company, a global company providing information to and about mutual funds, released a study in early 2002 that it conducted involving mutual fund expenses. [8] The study found that in 2001, total costs to U.S. fund shareholders for shareholder servicing expenses amounted to about $11 billion. This included transfer agent fees and a portion of 12b-1 fees.
Some fund families do a good job holding down costs and passing along the savings from the economies of scale that occur as fund assets grow. Vanguard is famous for its low costs and its continuing efforts to serve its shareholders well. Other fund families that have passed along economies of scale include Fidelity and T. Rowe Price. Interestingly, the Lipper study found that investors in midsized fund families incur lower expenses overall than shareholders in the larger fund families. The study determined that the larger fund groups wanted to offer a high level of service and felt that they needed to keep all of these operations in house to do the job. Many of the midsized companies, in contrast, outsourced these services to a third party that could provide them somewhat cheaper. Not surprisingly, the Lipper study found that most funds that are sold directly to shareholders have lower fees than those sold through intermediaries. Midsize firms selling their shares through the funds supermarkets increase their shareholder-servicing fees significantly. The conclusions from any analysis of mutual fund costs are clear: Costs do matter, even for equity funds with relatively large returns. For bond funds, as we saw in an earlier chapter, costs are crucial in determining long- term results. |
EAN: N/A
Pages: 94
