Viewing the Application on the Management Console
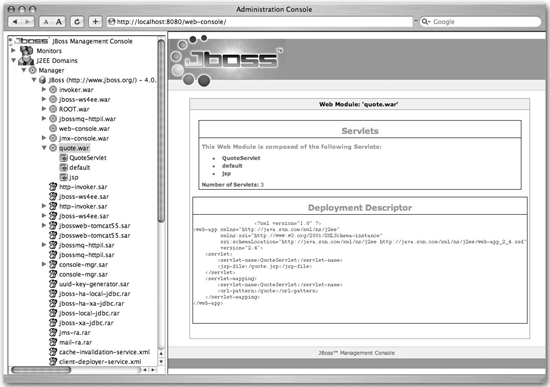
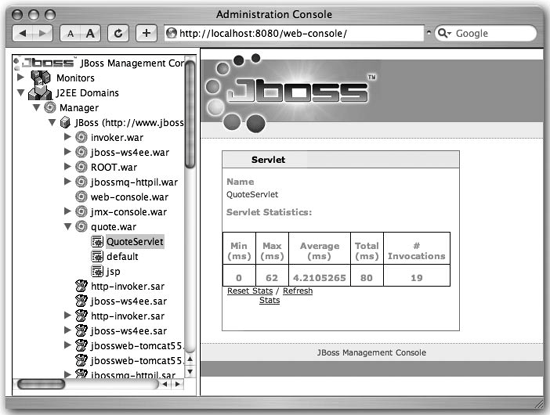
| Now that we've deployed the application and run it, let's see what it looks like in the JBoss Console. We'll take just a quick look at the console for now, but later in the book we will cover it in much more depth. How do I do that?To see the application in the JBoss Console, you need to open your web browser and go to http://localhost:8080/web-console/. You'll see a screen like Figure 2-5. Developer's Notebook 2-5. Web console open to quote.war You can see quote.war under the JBoss server. You can see that it has QuoteServlet in it, which is what we told it to create from the quote.jsp file in web.xml. If you choose QuoteServlet, you will see servlet statistics about it, including the number of times it has been invoked (see Figure 2-6). Developer's Notebook 2-6. Servlet statistics If you have not closed your web browser, you can reload the application at http://localhost:8080/quote/quote and then click QuoteServlet again to cause the web console application to refresh, at which point you should see the "# Invocations" count go up (see Figure 2-7). What just happened?You just saw the JBoss web console and your application deployed onto the server. You also saw that when you ran your application again, the web console could show you those changes. We will spend quite a bit more time on the web console later in the book, but for now we just wanted to give you a quick view of it and show you the possibilities. |
EAN: 2147483647
Pages: 106