|  PP07S-3.1.1 An organization chart shows the reporting relationships between individuals in an organization. For example, you can show the relationship between a manager and employees within a company. You can create an organization chart using a SmartArt graphic (New!) or using Microsoft Organization Chart. If you're creating a new organization chart, a SmartArt graphic is your best choice. If you need to match an existing organization chart from a previous version of PowerPoint, Microsoft Organization Chart is your best choice. A SmartArt graphic organization chart makes it easy to add shapes using the graphic portion or the Text pane. Create an Organization Chart Using a SmartArt Graphic 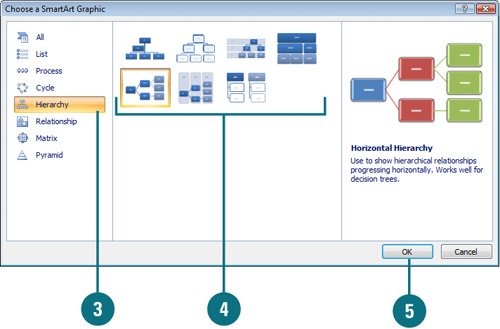 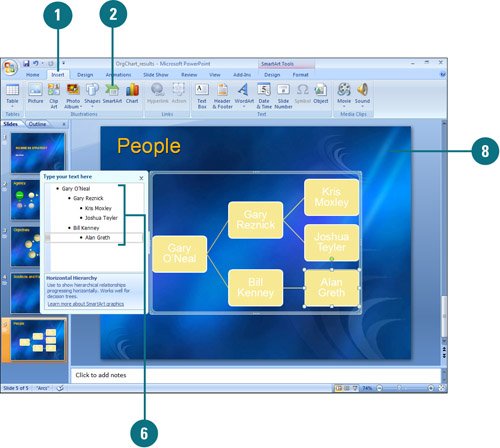
 Click the Insert tab. Click the Insert tab.
 Click the SmartArt button. Click the SmartArt button.
 In the left pane, click Hierarchy. In the left pane, click Hierarchy.
 In the right pane, click a SmartArt organization chart type. In the right pane, click a SmartArt organization chart type.
 Click OK. Click OK.
The SmartArt graphic appears with a Text pane to insert text.  Label the shapes by doing one of the following: Label the shapes by doing one of the following:
Type text in the [Text] box. You can use the arrow keys to move around the Text pane. Click a shape, and then type text directly into the shape.
 To add shapes from the Text pane, place the insertion point at the beginning of the text where you want to add a shape, type the text you want, press Enter, and then to indent the new shape, press Tab or to de-indent, press Shift+Tab. To add shapes from the Text pane, place the insertion point at the beginning of the text where you want to add a shape, type the text you want, press Enter, and then to indent the new shape, press Tab or to de-indent, press Shift+Tab.
 When you're done, click outside of the SmartArt graphic. When you're done, click outside of the SmartArt graphic.
Add a Shape to an Organization Chart 
Select the shapes in the SmartArt graphic you want to modify. Click the Design tab under SmartArt Tools. Click the shape with the layout you want to change. Click the Add Shape button arrow, and then select the option you want: Add Shape After or Add Shape Before. Inserts a shape at the same level. Add Shape Above or Add Shape Below. Inserts a shape one level above or below. Add Assistant. Inserts a shape above, but it's displayed at the same level at the end in the Text pane.
When you're done, click outside of the SmartArt graphic.
Did You Know? You can create organization charts using other methods. You can also use Office Visio 2007 or Organization Chart (also known as Microsoft Organization Chart 2.0), which was used in PowerPoint 2003 or earlier. Click the Object button in the Text group on the Insert tab to insert an organization chart. |
|