Charting a PivotTable

graphics/microsoft42.gif

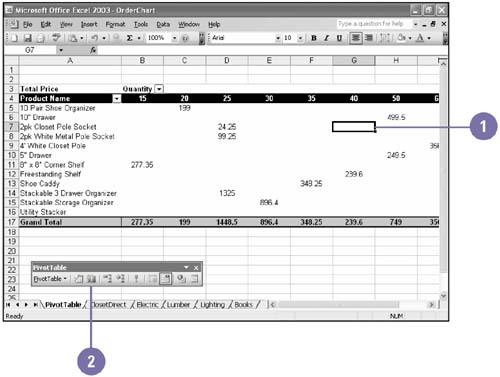
Data summarized in a PivotTable is an ideal candidate for a chart, since the table itself represents an overwhelming amount of data. A chart of a PivotTable is called a PivotChart . Once you select data within the PivotTable, you can chart it like any other worksheet data using the Chart Wizard. If you don't have a PivotTable, you can create a PivotChart and a PivotTable at the same time.

Create a PivotChart Report from a PivotTable Report

graphics/one_icon.jpg

Click any data field in the PivotTable.

graphics/tow_icon.jpg Click the Chart Wizard button on the PivotTable or Standard toolbar.

The PivotChart is created on a new worksheet.

graphics/10inf33.jpg

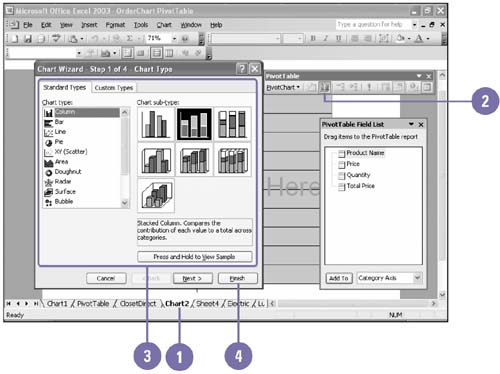
Modify a PivotChart Report

graphics/one_icon.jpg

Click the worksheet tab with the PivotChart you want to modify.

graphics/tow_icon.jpg

Click the Chart Wizard button on the PivotTable or Standard toolbar.

graphics/three_icon.jpg

Make selections from each of the four Chart Wizard dialog boxes.

graphics/foure_icon.jpg

Click Finish.

graphics/10inf34.jpg

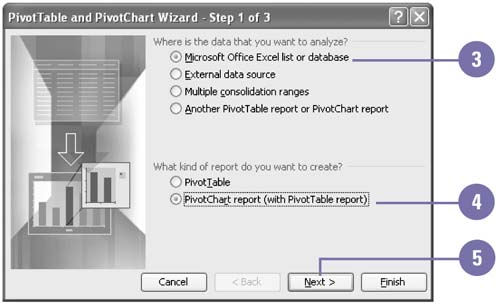
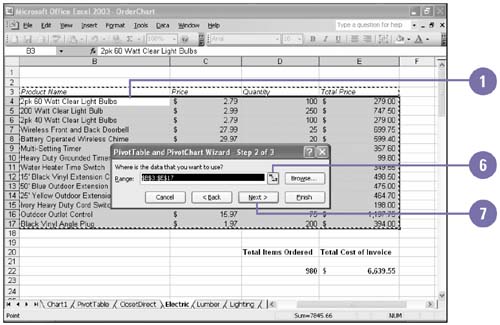
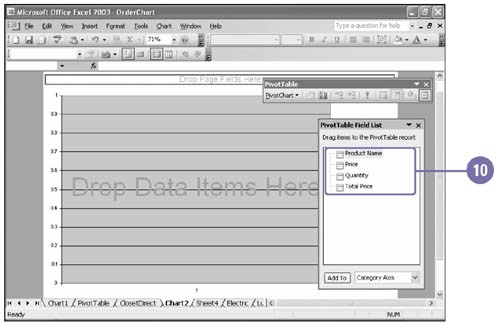
Create a PivotChart Report with a PivotTable Report

graphics/one_icon.jpg

Click any cell within the list range.

graphics/tow_icon.jpg

Click the Data menu, and then click PivotTable And PivotChart Report.

graphics/three_icon.jpg

If using the list range, click the Microsoft Excel List Or Database option.

graphics/foure_icon.jpg

Click the PivotChart Report (With PivotTable Report) option.

graphics/five_icon.jpg

Click Next to continue.

graphics/six_icon.jpg

If the range does not include the correct data, click the Collapse Dialog button, drag the pointer over the list range, including the field names , to select a new range, and then click the Expand Dialog button.

graphics/seven_icon.jpg

Click Next to continue.

graphics/eight_icon.jpg

Click the desired location of the new PivotTable.

graphics/nine_icon.jpg

Click Finish.

graphics/ten_icon.jpg Drag the data and fields you want from the PivotTable toolbar to the different area of the PivotChart.

The PivotTable is created as you create the PivotChart.

graphics/10inf35.jpg

graphics/10inf36.jpg

graphics/10inf37.jpg


Show Me Microsoft Office Excel 2003
ISBN: 0789730057
EAN: 2147483647
Year: 2002
Pages: 291

flylib.com © 2008-2017.
If you may any questions please contact us: flylib@qtcs.net