Editing a Chart
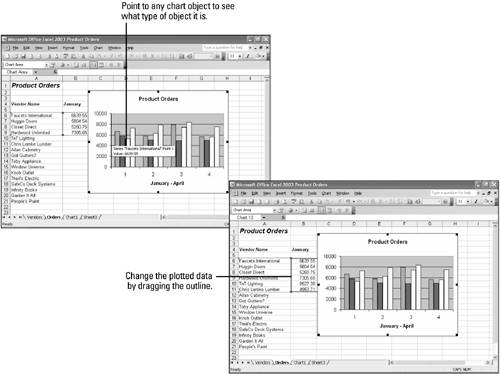
| Editing a chart means altering any of its features, from data selection to formatting elements. You might want to use more effective colors or patterns in a data series, for example. To change a chart's type or any element within it, you must select the chart or element. When a chart is selected, handles are displayed around the window's perimeter, and the Chart toolbar is displayed: all buttons on this toolbar function when the chart is selected. As the figure below illustrates, you can point to any object or area on a chart to see what it is called. When you select an object, its name appears in the Chart Objects list box on the Chart toolbar, and you can then edit it. Editing a chart has no effect on the data used to create it. You don't need to worry about updating a chart if you change worksheet data because Excel automatically does it for you. The only chart element you might need to edit is a data range. If you decide you want to plot more or less data in a range, you can select the data series on the worksheet, as shown in the figure below, and then drag the outline to include the range you want in the chart. |
EAN: 2147483647
Pages: 291