Why Should You Use a Pivot Table?
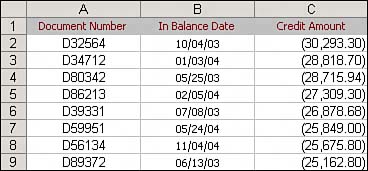
| As a rule, your dealings in Excel can be split into two categories: calculating data and shaping (formatting) data. Although there are many built-in tools and formulas that facilitate both of these, the pivot table is often the fastest and most efficient way to calculate and shape data. Let's look at one simple scenario that will illustrate this point. You have just given your manager some revenue information by month, and he has pre dictably asked for more information. He adds a note to the worksheet and emails it back to you. As shown in Figure 1.1, he would like you to add a line that shows credits by month. Figure 1.1. Your manager predictably changes his request after you provide the first pass of a report.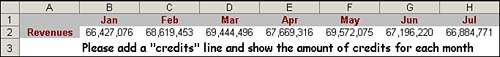 To meet this new requirement, you run a query from your legacy system that will provide the needed data. As usual, the data is formatted specifically to make you suffer. Instead of data by month, the legacy system provides detailed transactional data by day, as shown in Figure 1.2. Figure 1.2. The data from the legacy system is by day instead of by month.
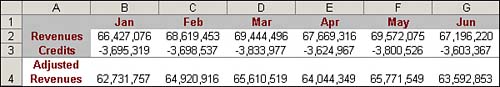
Your challenge is to calculate the total amount of credits by month and shape the results into an extract that will fit the format of the original report. The final extract should look like the data shown in Figure 1.3. Figure 1.3. Your goal is to produce a summary by month and transpose the data into a horizontal format.
If you were to create the extract manually, it would take 25 mouse clicks and three keystrokes:
In contrast, creating the extract with a pivot table takes just 10 mouse clicks:
Both methods give you the same extract, which can be pasted into the final report, as shown in Figure 1.4. Figure 1.4. After adding credits to the report, you can calculate net revenue.
Using a pivot table to accomplish this task cuts down the number of actions by more than half and reduces the possibility of human error. Over and above that, using a pivot table allows for the quick and easy shaping and formatting of the data. What this example shows is that using a pivot table is not just about calculating and summarizing your data. Pivot tables can often help you do a number of tasks faster and better than using conventional functions and formulas. For example, you can use pivot tables to instantly transpose large groups of data vertically or horizontally. You can use pivot tables to quickly find and count the unique values in your data. You can also use pivot tables to prepare your data to be used in charts. The bottom line is that pivot tables can help you dramatically increase your efficiency and decrease your errors on a number of tasks you may have to accomplish with Excel. Pivot tables can't do everything, but knowing how to use just the basics of pivot table functionality can take your data analysis and productivity to a new level. |
EAN: 2147483647
Pages: 140