Chapter 12: Applied Path Analysis
|
|
Several years ago when I first presented the material in this chapter at a software testing conference, it was very enthusiastically received, but the audience was very definitely divided into two distinct camps at the end of the presentation. Bill Silver, who is, among other things, a total quality management guru, was in the audience. Bill summed it like this: "When Marnie finished her talk, there were two types of people in the audience. The ones that understood exactly what Marnie was talking about, and the experts." The rest of this chapter is dedicated to trying to explain my approach to testing in terms everyone can understand.
Correcting Problems with Depth Perception: Or How This All Got Started
The project was a shopping application running on a large private network. The director in the project, a different one than the one I spoke of in the Introduction of this book, came to the presentation with only one foil. Everyone involved in the project was there-testers, developers, content producers, and network support. He began his presentation by putting up his foil. It had a picture similar to Figure 12.1 on it.
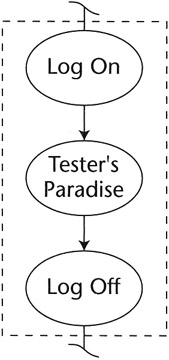
Figure 12.1: The director's foil.
"This is how it works," he said. "The users log on to the network. They jump to the application, they select products that they want to buy, fill in a shipping form, give a credit card number, and then log off. Two to 10 days later, their merchandise arrives at the address they provided. We know there are about 3,000 lines of new code here," he said, pointing to the first bubble, "45,000 lines of code here," pointing to the second bubble, "and 1,000 lines of code over there," pointing to the last bubble. "There is also some new code at the distribution centers. But it's not that complicated. We've sized the effort based on the new function, and we estimate that it shouldn't take more than 12 weeks to write and integrate the system. Based on the development effort, it should take about two weeks to test it. So, we should be ready for product rollout about 14 weeks after we start writing code." This is what is known in the industry as "the view from 50,000 feet." If this is the only view that management sees, those of us in the trenches are in trouble. This manager had no idea what was behind the bubbles on the diagram.
It's normal at this stage for the testers to have no more idea than the director what is behind those bubbles. Testers might even have agreed, given what they had just heard, that two weeks would be sufficient. In this particular case, the tester responsible for the project asked me to help out with the test estimation. Since all phases of that test effort were planned and executed using the MITs methods, it has become the example I prefer to use when teaching these methods.
The analysis of the application used the requirements, logical function paths, network paths, and data analysis to build the test inventory used for estimation. The starting point for the functional analysis was the GUI. Developers provided the network path details. Almost 400 end-to-end function test scenarios were required to provide adequate test coverage of that project. Even though the actual test effort was able to drastically reduce the time required to perform testing by using the methods presented in this book, along with automated test tools, it still took somewhat longer than two weeks to test the three-bubble application on the foil.
The Game Show Analogy
I searched for many years for an analogy that would explain the concepts and problems of dealing with user function paths though real systems in terms everyone could understand. My favorite way of explaining this is by the Doom [1] analogy. Doom is a hit video game that features an abundance of dark, confusing, monster-filled mazes, each tucked behind a color-keyed door. For those not familiar with video games, think of it like a television game show where contestants win whatever is behind the door they choose. Most people don't have too much trouble imagining a lot of stuff behind one of those doors.
A software system is like a maze full of doors. Each door is the entry-way to some other component or process in the system. At each door a decision will be made to open or not to open. Behind each one of those doors there are other mazes. It is possible to start at the user interface and descend through the layers of a system into the source code of program modules, and sometimes even into the processing instructions of the hardware. This type of testing is called top-down testing.
Imagine that each of those bubbles on the director's foil is such a door. This is a very good conceptual picture of the way internal logic paths of a software system look when viewed from the top down-that is, from the user's perspective. The tester must verify and validate or, if there is no map, explore what is behind those doors. Each component in the system has its own internal independent paths (IPs). The sum of all the IPs is the total for the system. Testing each component independently, bottom-up testing, will not verify that all the user functions will work properly.
Getting a Map
Top-down testing can proceed very quickly if the tester has a map and knows from the beginning what he or she is up against-how big it is, where things are, and so on. In general, however, if there are to be any maps, it is the testers who will create them, usually as they go. Many test efforts are conducted without a map ever being created at all. It may just be a holdover from when I did my surveying school in the Canadian wilderness, but if I have to follow a path with more than two turns in it, I make a map.
True to this real-life scenario, the Doom game has a map function that shows the player a map of the corridors they have traversed up to their current point in the game. Such a map does not indicate how much of the maze remains unexplored. In testing, we call this a dynamic analysis test tool. In Doom, there are also master maps hidden in the maze that show the entire current maze, including hidden and secret corridors. This type of map is created by a static analysis tool.
In testing, commercial tools that perform static and dynamic analysis typically produce reports of different characteristics of the system, such as how many branches exist and the call tree structure. These tools will show the paths that have been traversed on the entire system map. This type of map combines both static and dynamic analysis and gives the viewer a graphical view of how much of the system has been traversed and how much remains. These maps are maps of the component-level paths. So while they are great aids for unit testing and module integration testing, they are generally too low level to be much help in a top-down system test. Also, these tools are platform- and language-specific and are generally expensive. If the system under test uses several hardware platforms, operating systems, and components written in several languages, this means a different tool for each. And there is no map of the paths between these disparate components in the system.
I have long lobbied for the inclusion of such mapping functions in applications and systems themselves as part of the code. But historically, diagnostic functions such as these are rarely included in the plan, and if they are, they are usually the first functions to be cut when deadlines approach. The result is that inexpensive and easily accessible user function maps have been rare until the advent of the Web.
While static analysis and mapping functions are not included in most traditional software applications, they are an integral part of a Web application. Most commercially available Web site creation tools offer site maps that show all the documents and links in a Web site. Figure 12.2 shows the hyperlink view of a page in the testersparadise.com Web site. Now standard in Web content creation packages, this type of tool creates graphical maps of the paths from a given page like the one shown here.
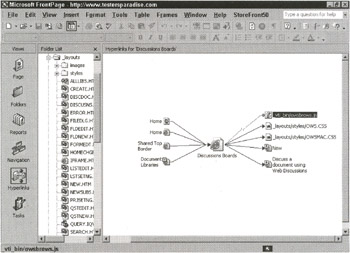
Figure 12.2: Automatic hyperlink analysis is a part of most Web content creation tools.
In addition, a series of reports are commonly available today in Web content creation and management tool sets that can be used to automatically certify that a Web site has no missing files, no extra files, and no broken links. While such tools can verify all the navigational links in a site, they cannot validate the links-that is, these tools cannot show that the links go to the logically correct location, only that they do navigate to a location that exists. Figure 12.3 shows the Web site Reports view from FrontPage 2002.
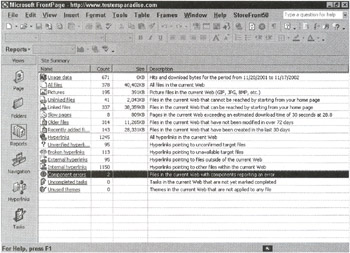
Figure 12.3: Automatic Web site Reports view in FrontPage 2002.
In addition to reporting statistics on hyperlinks, other reports show items such as unlinked files. These are effectively dead files that can't be accessed except by a direct link or via a search. The view in Figure 12.3 shows a Web technician most of the important points of failure in the site. In the figure, the line highlighted shows that two application components are reporting errors.
Because of their traceability, Web applications lend themselves to automated testing and monitoring. As a result, they are much more testable than traditional applications. Web test tools cost a fraction of their traditional counterparts, and they are readily available on the Web. The cost of testing and certifying the Web equivalent of a client/server application is only a fraction of the cost of testing a client/server application. But, unfortunately, as helpful as these Web analyzer maps are, they still do not take the place of a logic flow diagram, as we will see in a moment.
On the dynamic analysis side, the Web server keeps a log of every request made by a user and what the server did with the request, such as whether it sent the item, transferred the user to a different host, or returned an error message. Because of this feature, a wealth of information is available about how users find the site, what they do when they get there, what browsers they are using, and so on. The paths that users follow can be tracked and analyzed automatically; Figure 12.4 shows some of the most common usage reporting used in a Web site. There are specialized tools that can extract even more information than these 13 reports suggest. The graph in the background shows the number of visitors, page hits, and total hits to the site over a three-month period.
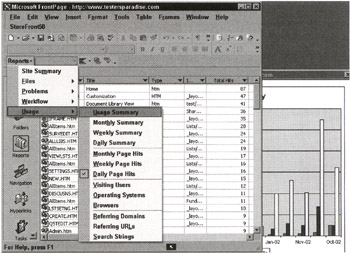
Figure 12.4: Web site usage Reports view in FrontPage 2002.
All of this information is valuable to both testers and administrators. Actual usage information is invaluable when predicting and monitoring the most important areas to test.
[1]Doom is a trademark of id Software, Inc.
|
|
EAN: 2147483647
Pages: 132