A.2 Interaction Diagrams
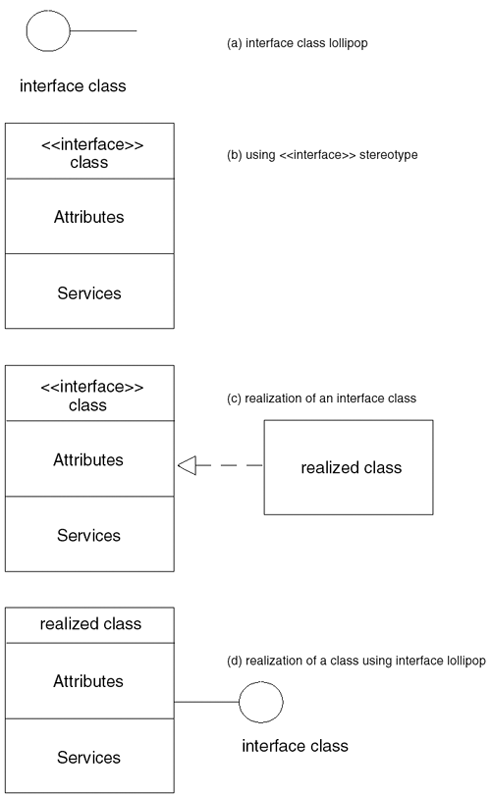
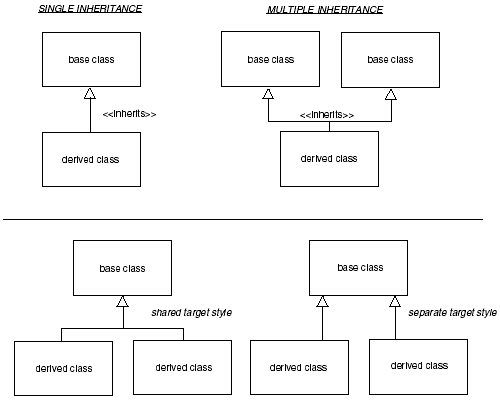
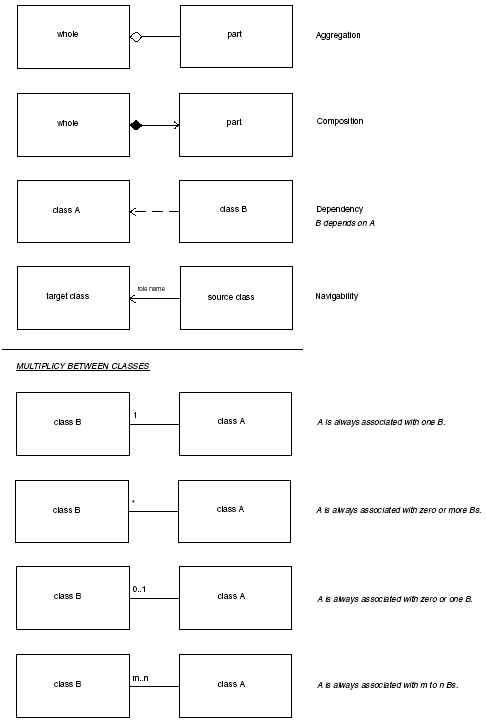
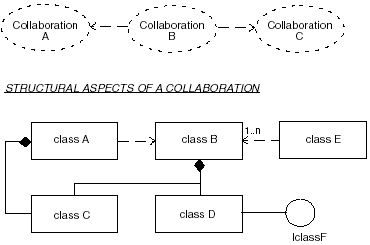
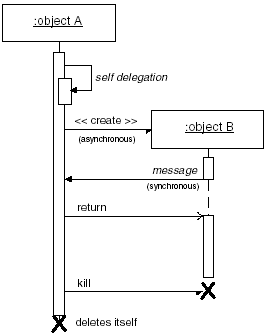
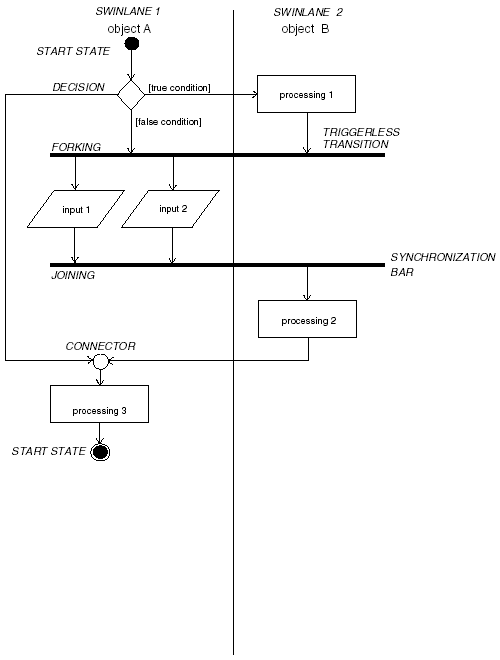
| Interaction diagrams show the interaction between objects. It consists of a set of objects, their relationship, and the messages exchanged between them. Interaction diagrams include collaboration, sequence, and activity diagrams. A.2.1 Collaboration DiagramsCollaboration diagrams are used to show a set of objects working together to perform some work. The collaboration in the system is a temporary cooperation between a set of objects. Collaboration diagrams can depict the organization of the collaboration or can depict the structure of the collaboration. This involves showing all the objects in the set, their links, and the messages sent and received between them. A.2.2 Sequence DiagramsSequence diagrams are used to emphasize the time ordering of messages received and sent by objects in a system. Figure A-4. The ways to represent an interface class. An interface class can be represented using a lollipop symbol or as a regular class displaying the <<interface>> stereotype. The relationship between the interface class and the realization of the class can also be depicted. Figure A-5. The ways to represent single and multiple inheritance. There are two target styles that can be used when multiple classes are involved in a relationship: shared and separate. With the shared target style, multiple classes are tied to a single inheritance symbol that points to the target class. With the separate target style, each class has its own inheritance symbol. A.2.3 Activity DiagramsActivity diagrams show the flow of control from one activity to another. Activities are actions performed by objects. Actions include processing input/output, creating or destroying objects, or performing computations . Activity diagrams are similar to flowcharts. Figure A-6. Examples of the multiple relationships that can be depicted in a class diagram. Multiplicity notation can be used to show the number of instances between classes and objects. Figure A-7. A collaboration diagram showing the organization of collaborations within a system and the structural relationship of objects within a collaboration. Figure A-8. A sequence diagram is used to emphasize the time ordering of messages passed between objects. The active objects are placed at the top on the x -axis of the diagram. The messages passed between the objects are placed on the y -axis of the diagram. The diagram can depict synchronous and asynchronous messaging. The time ordering of messages is demonstrated by reading the messages from top to bottom along the y -axis. Figure A-9. Activity diagrams show the action of objects as it flows from the focus of control of one object to another. It depicts the forking of multiple flows of control (concurrency) and joining of flows of control with a synchronization bar. Swimlanes are used to show which object is performing the action. Transitions may cut across swimlanes. A synchronization bar may also cut across swimlanes, indicating multiple flows of control reside in different objects performing actions concurrently. |
EAN: 2147483647
Pages: 133
