Result Objects
|
| < Day Day Up > |
|
To see individual objects within each class, click the + next to the class. To add columns of data to the report, drag the individual object from the Classes and Objects window to the Results Objects window or double-click the object name. When you drag an object, the cursor changes, as shown in Figure 21-2. You also can drag an entire class of objects to the results pane. Ideally, you should sort the order of the result objects from left to right by how you want them to appear in the initial report. This is typically from largest dimension to smallest dimension, with the measures rightmost. Once you execute a query, the order of the result objects and that of the variable columns in a report do not necessarily match. As you add additional dimension or detail result objects to the query, the variable columns are inserted preceding the measure columns in a report. Reordering the columns via the Slice and Dice Panel does not affect the order of the columns in the query.
To remove a result object, select the object and press DELETE. Alternatively, you can drag an object from the Result Objects window back to the Classes and Objects listing.
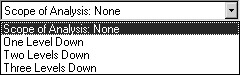
Scope of Analysis
As discussed in Chapter 19, “Scope of Analysis,” the Scope of Analysis button enables you to retrieve additional columns of data for multidimensional analysis without immediately displaying the results in the report. The details exist in the microcube and become available when you select Drill By or Drill Down. The Scope of Analysis dialog box called from the Query Panel is the same as the Scope of Analysis box called from the Explorer pop-up menu. However, the Query Panel also allows you to specify a scope of analysis by levels.
The data retrieved by the microcube directly corresponds to the result objects in your query. In this respect, the levels are relative and not fixed. For example, lookat the sample hierarchies in Figure 21-3 and the currently displayed result objects in Figure 21-2. From the Producer hierarchy, Country is a result object in the query. If you change the Scope of Analysis to Two Levels Down, then the query will also retrieve results for Region and Producer. Color and Varietal are also result objects in Figure 21-2. Varietal is the lowest level of detail within the Varietal hierarchy, so the Two Levels Down specification has no effect on additional query columns. The levels selection applies only to dimensions currently used as result objects; therefore, changing the Scope of Analysis to Two Levels Down does not retrieve additional columns from the Vintage hierarchy, as the query contains no objects from the hierarchy.
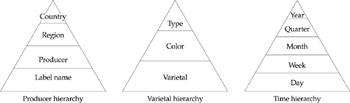
Figure 21-3: Three sample hierarchies
The following table shows another example of how the levels are relative using the time hierarchy from Figure 21-3. For each example, assume that the Scope of Analysis is changed to Two Levels Down.
| If the current result object is | Then the query also retrieves |
|---|---|
| Year | Quarter, Month |
| Quarter | Month, Week |
| Month | Week, Day |
| Week | Day |
| Day | No additional columns, as it is the lowest level of detail in the hierarchy |
|
| < Day Day Up > |
|
EAN: 2147483647
Pages: 206