Formulas
|
| < Day Day Up > |
|
Most of the data you have manipulated in this chapter comes from results that a data provider returns to the microcube, which is then called a variable. As you added Calculations to the report, BusinessObjects automatically inserted formulas. Formulas allow you to manipulate the raw variable data in a number of ways. Because the manipulation is against the local report variables, they can use a proprietary BusinessObjects syntax that overcomes many limitations of SQL. You can use formulas to create new variables. The disadvantage to formulas and created variables, though, is that they are document-specific. In this respect, you must re-create formulas for each new document, a process that can be maintenance-intensive. While I like the power and flexibility formulas provide, I caution you to evaluate whether you really should create an individual report formula or work with the universe designer to create more powerful objects. See Chapter 13, “User Reports,” for a more thorough discussion of this issue.
When you create or modify a formula, the formula is available to all reports within a document. BusinessObjects provides several sets of formula functions that allow you to manipulate different types of data. For example, the calculations via the Slice and Dice Panel are referred to as aggregate functions; they allow you to create different types of subtotals (SUM, AVERAGE, MIN, MAX, and so on). Aggregate functions also allow you to create running totals, averages, and others. The conversions to Euro were accomplished through a numeric function (EuroConvertTo); numeric functions allow you to manipulate columns of numbers. In addition, there are character, date, logical, document, and data provider functions. The Formula Editor, shown in Figure 18-8, also provides operators for straightforward calculations such as subtraction and division as well as more complex manipulations with If-Then-Else and Where.
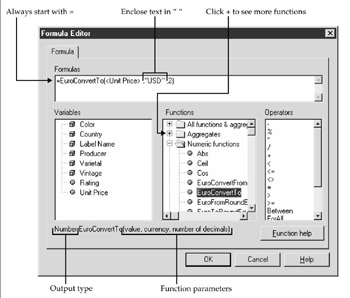
Figure 18-8: The Formula Editor helps you write complex formulas.
There are multiple ways to launch the Formula Editor and to insert a formula into a block:
-
Insert a blank column in a report and then select Data | Edit Formula.
-
Display the Formula bar with View | Formula Bar, then click the Formula Editor button from the bar.
-
Select the pull-down menus Data | Variables, then select Add to launch the Variable Editor and Formula Editor. If you do not give the variable a name, it is treated as a formula and not a variable.
Once you have created a formula or variable, you can select it either from the Report Manager or the Slice and Dice Panel to insert it into an existing block. With this approach, BusinessObjects will automatically insert a new column for the new formula.
As you work with the Formula Editor, you can perform simple calculations such as = <Unit Price>*1.06 or you can work with functions. When you work with functions, you insert the function first, then the variable to which it applies and any additional parameters. As you select an individual function, the Formula Editor displays the syntax at the bottom of the dialog box. Notice in Figure 18-8 that it also displays the output type for the particular function; this is important, as the variable type and function must be compatible. Certain functions will change the output type. For example, the date function Year will change a date type field to number; once it is converted to number, you can no longer use other date functions against the new variable unless you convert it back again.
From within the Formula Editor, you also can click Function Help to access more information about the function and see examples.
As you create your own formulas, follow these guidelines:
-
Always start the formula with an = sign.
-
When you reference a variable name, enclose it in brackets <>. In Figure 18-8, <Unit Price> is the variable.
-
The formula function must correspond to the variable type. For example, Unit Price is numeric; therefore, you can use aggregate and numeric functions with this variable. Often, date functions can pose a challenge when the original column is stored as a number—for example, year. In this case, first convert the year to a date, then use the date functions.
-
Enclose text parameters in quotation marks.
-
Do not enclose numeric parameters in quotation marks.
-
If you want to use an alerter on a formula column, you must first convert the formula to a variable.
Using Formulas as Variables
When you want to reuse a formula in different reports or perhaps in another formula, you can either explicitly create the formula as a variable or convert an existing formula to a variable. By identifying a formula as a variable, you also can apply alerters to the new variable or store the formula as a dimension to use for drill-down analysis.
Creating a New Variable
To create a variable from a new formula:
-
Select Data | Variables.
-
The Variables dialog box lists the current variables, formulas, and constants. From the Variables dialog box, click Add.

-
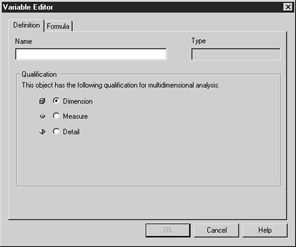
BusinessObjects displays the Variable Editor. On the Definition tab, you specify a name and a qualification. The variable name becomes the column headings in reports and is displayed in the Slice and Dice Panel and the Report Manager.
-
Select Dimension for Character, Date, and Numeric fields that you may want to sort and drill by; select Detail for detailed information such as phone numbers and street addresses that you will not use in drill down; select Measure for numeric values that you want to analyze and aggregate.
Tip As you define the formula, BusinessObjects will propose a qualification based on the variables you use in the formula. If your formula contains a measure variable, it proposes that the new variable also be a measure. The proposed qualification may not always be correct. For example, if you want to flag highly rated wines (If <Average Rating> > 90 Then "High" Else "Normal"), then BusinessObjects will interpret it as a measure, when it should be a dimension given the result of the formula. Also, after you select a variable to use in the formula, the Type box in the preceding screen is also filled in according to the type of variable used in the formula (Character, Date, Numeric). While you cannot change the type, it is useful to know the variable type to ensure the function you use is compatible, or you will receive an error.
-
The formula tab displays the formula editor shown earlier in Figure 18-8.
-
Once you have defined the variable and the formula, click OK. The new variable now exists in the document or microcube. To display it in the report, use the Slice and Dice Panel to drag it to a new column.
Converting an Existing Formula to a Variable
If your report already contains a formula, you can convert the formula to a variable.
-
Select the column that contains the formula.
-
From the pull-down menu, select Data | Define As Variable or click the Define As Variable button from the Formula bar.
-
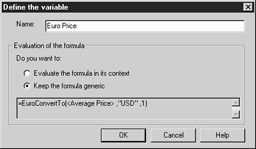
Enter a Name. This name becomes the variable name displayed in the Slice and Dice Panel and Report Manager.
-
You can choose to keep the formula generic or to fix the context in which the formula is evaluated. Contexts are explained in the next section.
-
Click OK to close the Define The Variable dialog box and return to the report. While the results of the calculation in the report may not have changed, the cell formula has changed to =<Variable> or, in this example, =<Euro Price>.
-
BusinessObjects will have automatically assigned a qualification (dimension, detail, or measure). If you want to change the qualification, choose Data | Variables, then Edit.
Calculation Contexts and Extended Syntax
With calculations and formulas you build yourself, BusinessObjects reevaluates the formula to give results based on the data displayed in the current block. This reevaluation happens automatically and is referred to as a context. In a typical formula, you never see the context. In certain circumstances, however, you may want to control the calculation context by using extended formula syntax.
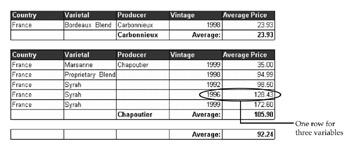
As an example, refer to the rows in the report in Figure 18-9. The second mini-table in the report contains seven rows of data with individual unit prices for French wines produced by Chapoutier. Even though there are multiple wines for a particular vintage, the automatic aggregation has been temporarily disabled to further illustrate the dynamic nature of calculations (Format | Table, select the General tab and the option Avoid Duplicate Rows Aggregation). The Average Price for these wines is $112.34.
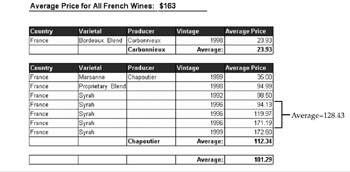
Figure 18-9: Calculations in columns and footers are reevaluated according to their context.
An input context defines which variables or subtotals within a report go into the calculation; the input context controls the level of detail in the calculation; therefore, these contexts are critical in calculating correct averages and counts. The output context determines at which point a subtotal should be calculated. A formula with extended syntax is written as follows:
=Function(<Variable> In InputContext) In OutputContext
BusinessObjects provides three operators that allow you to control the contexts:
-
In Works with context keywords such as Body, Block, Report, and CurrentPage
-
ForEach Works with dimension names to indicate the calculation should happen for each new value within a dimension
-
ForAll Indicates that the grand total for the dimension should be used in the calculation
The following table summarizes the different components of an input context that affect your calculations:
| Context Keyword | Area of Report |
|---|---|
| Body | The data displayed in the body of the table. By default, BusinessObjects reevaluates calculations according to what is displayed in the body. |
| Block | The individual row values; these may not be displayed in the body of the report, but they exist in the document. In order to get “weighted” averages, replace the Body input context with Block. |
| Report | The entire report. This component is relevant only for reports that contain multiple blocks. |
| CurrentPage | The current page within a report. Use this when you want to get a subtotal for one page in a multipage report. |
| <Variable> | <Variable> contexts specify at which point a new subtotal should be calculated. If you are using a cumulative aggregate function such as RunningSum, you can specify the context to be reset at a particular break level by inserting a semicolon before the break variable:CumulativeAggregate(<measure>; <dimension variable>). |
Displaying Extended Syntax
To see the extended syntax of a formula with the explicit contexts:
-
Display the Formula bar (View | Formula Bar).
-
Select the measure column or the break footer that contains the subtotal calculation. In the Formula’s text box, the simple formula is displayed as:
=<Average Price>
-
Position the mouse over the Formula bar in the text box (but do not click in the text box). The full formula with the context is displayed as a tool tip.

The full formula with contexts for the Average Price column is
=<Average Price> In (<Producer>, = RowIndex(), <Country>, <Varietal>, <Vintage>)
In the Producer break footer, the full context for Average Price in Figure 18-9 is
=Average(<Average Price> In Body) In <Producer>
The extended syntax for Average Price for the entire report replaces the In <Producer> output context with In Report:
=Average(<Average Price> In Body) In Report
Dynamic Contexts in Action
When automatic aggregation is re-enabled, the Average Price in Figure 18-9 is automatically calculated from the four dimensions displayed in the current table. The three rows for the vintage 1996 are collapsed, and the average of $128.43 is calculated; the individual rows still exist in the block but not in the body of the report; by default, BusinessObjects recalculates the averages from the numbers displayed or what appears in the body of the report.
This now poses a problem with the footer averages. Is the average price for Chapoutier wines $112.34, as shown in Figure 18-9, or is it a new result of $105.90 because one row at $128.43 replaced three rows for the Vintage 1996? Also note the new total average of $92.24 for the report ((23.93+105.90)/2) versus the former $101.29; the new average reflects a new input row of $128.43 rather than the three detail rows for 1996.
If you want to use the eight individual rows from Figure 18-9, rather than the six rows displayed in the body in the preceding table, to calculate the average, then change the input context from In Body to In Block .
To reflect an average price of $112.34 for Chapoutier wines, the formula at the break footer should be
=Average(<Average Price> In Block) In <Producer>
To reflect a total average price for both producers, the formula in the global footer should be
=Average(<Average Price> In Block) In Report
So far, these calculations have been affected by the columns that appear in the report. Another feature that affects the calculations are filters. So if you were to filter the report in Figure 18-9 by Varietal or by Vintage, all the footer averages would be recalculated. If you do not want them to be recalculated, then insert a NoFilter function into the formula:
=NoFilter(Average(<Average Price> In Block) In Report)
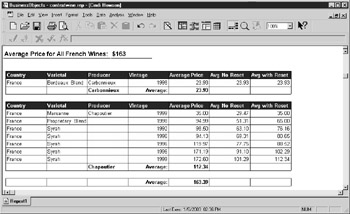
| Tip | You can copy a cell with a subtotal calculation to the main section of a report. This cell will reflect the grand total or overall averages for the entire report, regardless of the columns displayed and the rows filtered. The Average Price of $163 in Figure 18-9 is for all French wines, not just the two producers displayed in the table. Inserting NoFilter into the footer calculation has the same effect. |
Final Advice about Contexts
Extended syntax and contexts can be a painful concept to understand. So I want to make some sweeping generalizations to ease the process:
-
Do not worry about contexts for rows within a table that deal with straightforward sums.
-
Understand input contexts for averages, min, max, and count for break footers.
-
For rows within a table that use averages, min, max, or running aggregates, understand variable contexts and resets.
-
Leave output contexts at their default.
Some Popular Formulas
BusinessObjects provides dozens of functions that allow you to manipulate and better analyze the data. Some of the more frequently used functions are covered in the next sections.
If Then Else
If Then Else syntax appears in the Operator box of the Formula Editor. Use If Then Else logic to create complex formulas and powerful alerters.
The following formula describes a wine as Highly Rated if the Average Rating is > 90:
=If <Average Rating> > 90 Then "Highly Rated" Else "Normal"
To combine multiple comparisons in the If statement, enclose the comparison in parentheses. The following formula describes a wine as a Good Value if both the rating is above 90 and the Average Price is less than $100:
=If (<Average Rating> > 90 And <Average Price> < 100) Then "Good Value" Else "Normal"
Ratios
In calculating ratios, pay attention to the calculation order to get a correct subtotal. If your universe contains objects that are ratios, you must ensure that you create a calculation to recalculate the ratios at each subtotal or break level:
=Sum(<Sales revenue>)/Sum(<Quantity sold>)
If the universe does not already contain a ratio or price object, you may want to create a formula that calculates the price row by row:
=<Sales revenue>)/<Quantity sold>
As long as you do not convert this formula to a variable, you can reuse this same formula in the break footer. This is where dynamic contexts are truly wonderful, as BusinessObjects does not require you to create a new calculation for each subtotal; it does it automatically for you. There was a time in early versions in BusinessObjects in which you had to explicitly define which subtotal and break level to use; some other BI tools still require you to do this. As you added and removed breaks, you would have to manually redo the ratio/price formulas at each break level. For example, if you have a table that contains breaks at clothing line and year, you can insert the same formula =<Sales revenue>)/<Quantity sold> in the two break footers; the extended syntax is different for each footer, as shown in the following table. If you remove or add breaks, the new context is automatically specified. Awesome, isn’t it?
| Break Level | Formula with Extended Syntax |
|---|---|
| Second, Year | =(<Sales revenue> / <Quantity sold>) In (<Lines>, <Year>) |
| First, Clothing Line | =(<Sales revenue> / <Quantity sold>) In <Lines> |
| Grand Total | =(<Sales revenue> / <Quantity sold>) In Report |
To ensure that you do not receive a divide by 0 error, include an If statement to test the denominator for zero values.
=If Sum(<Quantity sold>)>0 Then Sum(<Sales revenue>)/Sum(<Quantity sold>)
| Tip | As part of the formula, you cannot specify a text value such as “NA” to display for those rows in which the Quantity Sold was 0, as “NA” is a text value and all other values are numeric. However, you can format the cells to display NA for Undefined values. Select Format | Cell, then choose Number. Select a desired format and in the Undefined box, enter NA. |
Year-to-Date Measures
Within the Date functions, BusinessObjects provides several functions that allow you to interpret date columns. In certain circumstances, the function converts a date variable to a numeric type variable. It’s important to pay attention to this nuance to avoid calculation errors.
-
CurrentDate reads the current date according to your computer and returns a date type.
-
Year formats a date variable to a four-digit year and returns a numeric value.
-
MonthNumberOfYear assigns a numeric value of 1–12 for a date field.
The following formula creates a Last Year Sales variable. If the year of the date on the computer minus 1 (last year) is equal to the year in the report, then display the amount sold; else, return 0.
=If (Year(CurrentDate())-1=<Year>) Then <Amount Sold> Else 0
To incorporate data up to and including the current month, include the month comparisons as well.
=If (Year(CurrentDate())-1=<Year> And <Month Number><=MonthNumberOfYear(CurrentDate())) Then <Amount Sold> Else 0
Concatenation
In certain circumstances, you may want to combine the values of two variables into one via the Character function Concatenation. This is useful for creating one formatted field that has both a first name and a last name in a form letter. Alternatively, you may have a column that contains an order number and an order line number. The order line number in itself is not a unique identifier unless it is combined with the order number.
Concatenation does not automatically trim blank spaces in fields, nor does it add spaces to make the newly combined cell legible—for example, to leave a space between a first name and a last name. To accomplish this, you can use RightTrim to trim blank spaces from a variable, and you can nest Concatenations to insert spaces between variables.
The following example creates a newly combined column that has both first name and last name. The “ “ in the formula inserts a space between the two variables:
=Concatenation(Concatenation(<Cust First Name> ," ") ,<Cust Last Name>)
A similar structure for order number and order line would be
=Concatenation(<Order Number> ,<Order Line>)
You do not want too many spaces between the first name and the last name. If the first name variable has extraneous blank spaces at the end of the field, then incorporate RightTrim to remove the blanks as follows:
=Concatenation(Concatenation(RightTrim(<Cust First Name>) ," ") ,<Cust Last Name>)
An alternative to the Concatenation function is the ampersand (&) operator. The ampersand allows you to combine several fields at once and so may be easier to read than nesting multiple Concatenation functions. The preceding formula would be restated:
=<Cust First Name>&" "&<Cust Last Name>
The following formula shows how you can incorporate multiple ampersands with other functions. The Substr function allows you to display part of a field starting in a particular position. To display the first initial of someone’s name, start in the first position and display one character:
=<Salutation>&". "&Substr(<Cust First Name>,1,1)&". "&<Cust Last Name>
Cumulative Aggregates
Cumulative aggregates incrementally aggregate each row of data within a report. By default, BusinessObjects will keep adding data through each break level in a report. If you want to create a running subtotal for a particular break level or mini-table, then insert a semicolon and a dimension variable to reset the calculation context:
CumulativeAggregate(<measure>; <dimension variable>)
RunningAverage calculates a running average for each row of data in the report. Compare the differences in RunningAverages in the following report. The first measure column uses the standard syntax. The last column in the report resets the average for each break in Producer. Business Objects refers to this variable as a reset context:
=RunningAverage(<Average Price>;<Producer>)
|
| < Day Day Up > |
|
EAN: 2147483647
Pages: 206
- Assessing Business-IT Alignment Maturity
- A View on Knowledge Management: Utilizing a Balanced Scorecard Methodology for Analyzing Knowledge Metrics
- Technical Issues Related to IT Governance Tactics: Product Metrics, Measurements and Process Control
- The Evolution of IT Governance at NB Power
- Governance Structures for IT in the Health Care Industry