Filter
|
| < Day Day Up > |
|
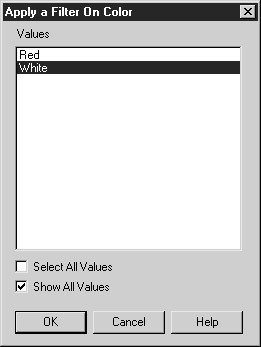
As you apply breaks, sorts, and calculations, you may find that you want to focus on one or more subsets within the report. Filters allow you to restrict the number of rows displayed in the report. They do not affect the query results; they affect only the data currently displayed in the block. It’s important to understand that the calculations will also change to reflect only what is displayed. In Figure 18-2, the table displayed both Red and White French wines. To focus only on White wines, insert a filter on Color.
-
From the Slice and Dice Panel, select the Color variable in the Block Structure.
-
Click Apply Filter.
-
BusinessObjects displays a list of values from data in the microcube. Select the desired values. Use CTRL-click to select multiple values. Click OK to close the Apply A Filter dialog box and return to the Slice and Dice Panel.
-
Click Apply to see the effect of the filter.
Complex Filters
In the preceding example, BusinessObjects displayed a simple list of values upon which you based the filter. This filter applied to the current block. In reports that contain multiple blocks, you can apply a global filter that filters data from both the chart and the table, for example. Complex filters also allow you to filter values based on a formula rather than a list of values. For example, you can select all products that start with a particular ID sequence, character string, or the like. If it’s likely that the filter values change as the query is updated, you also want the filter to be based on a formula, rather than fixed values. This is particularly true when you filter by measures. For example, if you want to identify customers that have bought more than $1,000 worth of products, the precise values and corresponding customer list will change each quarter as customers buy more products; Customer A may buy $1,010 by Q2 and then $1,200 by Q3. For these instances, you want to create a filter based on a formula rather than a fixed list of values. You do this within the Report window and pull-down menu, not in the Slice and Dice Panel. In the following example, add a filter to identify wines with an average rating of 90 or higher:
-
From the Report window, position your cursor within the desired block.
-
Select Format | Filters. (Note that Insert | Filter and the Filter button from the Report toolbar only allows you to apply simple filters).
-
BusinessObjects displays a Filter dialog box (see Figure 18-4) that shows you any existing filters added via the Slice and Dice Panel. Filters under Global apply to all blocks in the existing report. Filters under Table 1 apply just to the particular table. Select Table 1.
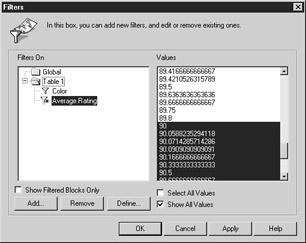
Figure 18-4: Complex Filters allow you to filter rows according to formulas. -
To define a new filter, click Add.
-
You will be prompted to choose a variable upon which to filter. In this case, select the measure Average Rating and click OK.
-
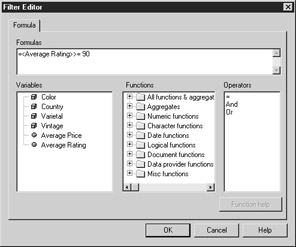
You are returned to the Filters dialog box shown in Figure 18-4. Click Define to create a filter formula. BusinessObjects displays the following Filter Editor. This editor is similar to the Formula Editor discussed later in this chapter, in “Formulas.”
-
Under Variables, select the comparison variable, Average Rating, and double-click to have it inserted in the Formula box.
-
Under Operators, select a comparison operator, >=, and double-click to have it inserted in the Formula box.
-
In the Formula box, enter a comparison value, 90.
-
Click OK to close the Filter Editor.
-
In the Filters dialog box, the asterisk next to the Filter Variable indicates it is based upon a formula. If you click Apply, the dialog box displays which values are selected by the filter. Because it is a formula, this selection list is not fixed; if a value of 90.1 appears in the next query refresh, this new value also will be selected because it is >= 90.
-
Click OK to close the Filters dialog box and see the table with the new filter.
Caution From within the Filter Editor, you can in theory select a different variable for comparison than the one selected in step 7; however, BusinessObjects ignores any part of the formula that deals with a different variable, which is rather misleading. For example, suppose you wanted to create a filter:
=<Country>=“France” And <Average Rating> >= 90If the variable selected in step 7 is Average Rating, then the <Country>="France" part of the formula is ignored; if the variable selected in step 7 is Country, then <Average Rating> >= 90 is ignored. In order to accomplish the preceding selection criteria, you must create multiple filters for each variable. In certain circumstances, you may want to nest the filters—for example, wines with a Rating >=90 And with an Average Price <=100. In order to do this, you would first create a formula to identify these rows, and then filter on the formula result. Refer to the section "Formulas," later in the chapter. Version 6 allows you to add multiple variables in one complex filter.
Tip In the Filters dialog, the Values column may contain #EMPTY for rows that contain null values. You also can click Define and use the Filter Editor to create a formula to select null values or to suppress null values. For example, to create a list of wines for which there are no prices, use the logical function IsNull:
= IsNull(<Average Price>)
To create a list of wines for which prices are available, incorporate the Not operator:
= Not IsNull(<Average Price>)
|
| < Day Day Up > |
|
EAN: 2147483647
Pages: 206