Chapter 18: Analyzing the Data: the Slice and Dice Panel
|
| < Day Day Up > |
|
The Slice and Dice Panel is your key to analyzing data. It allows you to sort information, group it, create calculations on groups, and filter the data to further analyze a subset of information. While many options in the Slice and Dice Panel are also available via separate pull-down menus and toolbars, the Slice and Dice Panel is more intuitive and allows you to apply multiple options simultaneously. Once you have added different sorts, breaks, and filters, you may find that you want to take your analysis further by creating custom variables and formulas. The formula syntax BusinessObjects provides is quite powerful and overcomes many of the limitations in SQL; it thus provides you with functionality that the universe and query may not otherwise provide.
The Slice and Dice Panel
To launch the Slice and Dice Panel, click the Slice and Dice button from the Standard toolbar or use the pull-down menu Analysis | Slice and Dice.
Figure 18-1 shows the Slice and Dice Panel. Unlike when using other panels within BusinessObjects, you can leave the Slice and Dice Panel active while you view the effects of your analysis. You can minimize, maximize, and resize the panel.
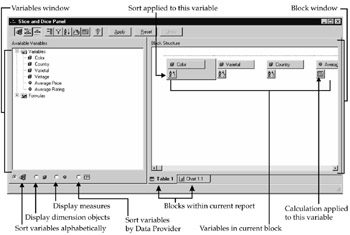
Figure 18-1: The Slice and Dice Panel enables you to analyze data.
The Slice and Dice Panel also contains its own toolbar. The buttons it contains are described in Table 18-1. You can also access some of these options within the main Report window via the Report toolbar (View | Toolbars, then select Report). The Slice and Dice Panel allows you to apply multiple functions to multiple columns at the same time. When you are working with large data sets, this approach is faster than applying functions one column at a time via the Report toolbar.
| Button | Name | Function |
|---|---|---|
| | Show/Hide Available Variables | Within the Slice and Dice Panel, all available variables from all data sources are displayed in the Variable window, whether or not they exist in the current block. If you do not want to see all the variables, click this button to hide the Variables window. |
| | Show/Hide Section | In a master/detail report, this displays the Master Cell(s). |
| | Show/Hide Status Bar | Hides the status bar. |
| | Apply Break | Apply a break to a dimension within the existing block. |
| | Apply Filter | Apply a filter to a dimension within the existing block. |
| | Apply Sort | Sort the data values. Once you add a sort to a column, double-click to set the sort to descending. |
| | Apply Ranking | Rank the data to display only the top or bottom values for a particular measure— for example, top-selling products or worst-selling products. |
| | Insert Calculation | Insert a sum, average, count, and so on, for a column of data. Note: variance calculations are not available via the Slice and Dice Panel; use the pull-down menus or Report toolbar. |
| | Help | Display contextual help. |
| | Apply | Apply the changes added in the Slice and Dice Panel to the block within the Report window. |
| | Reset | Remove all formatting and reset to the default style. |
| | Undo | Undo the last change set through the Slice and Dice Panel. |
Available Variables displays all the dimensions, measures, details, and formulas in the current document. When you first create a report, the Available Variables and the variables in the right in the Block Structure are one and the same. By default, these are sorted alphabetically. If you want to sort them by Data Provider, click the radio button in the bottom-left corner.
The Block window displays the variable names within the current block. If you have more than one block, such as a table and a chart as shown in Figure 18-1, the block types and names are displayed across the bottom. Click a block tab to switch the display to another block within the same report.
|
| < Day Day Up > |
|
EAN: 2147483647
Pages: 206