Report Manager
|
| < Day Day Up > |
|
Report Manager is a tool that allows you to view and modify the components of each report. You can view the data variables, or you can view the structure of the report.
Data View
To display the Report Manager, click the Report Manager button from the toolbar or select View | Report Manager from the pull-down menu.
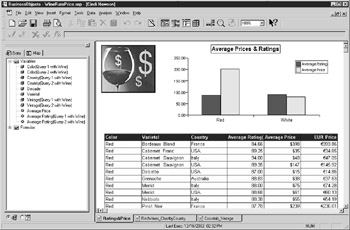
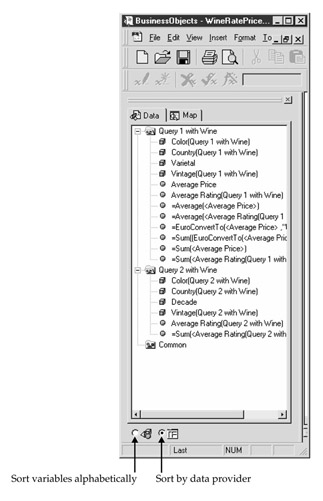
BusinessObjects displays the Report Manager in Data view. By default, Report Manager is anchored to the toolbar. You can drag and drop it to any place on the screen. Under Variables, all the variables in the microcube are listed alphabetically. Notice in the following screen that Vintage is a variable within the microcube, but Vintage is not displayed in the chart or table. You can add the variable to the block by dragging it from Report Manager to the block. Also, because this document contains two queries, there are two variables for Color, each from a different query. In this case, the contents for this variable are the same, but in other circumstances, they could be different. For example, Query 1 could contain a condition Where Color=Red and Query 2 could contain a condition Where Color=White.
To sort the variables by data provider rather than alphabetically, click the Data Provider icon from within Report Manager.
Map View
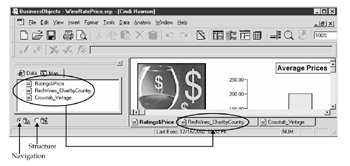
To switch to Map view, click the Map tab from within Report Manager. Initially, Report Manager shows a list that corresponds directly to the report tabs within the Report window. The Navigation icon in the bottom-left corner is selected. Navigation allows you to select individual reports within the document, or for master/detail reports, the individual sections.
To view the components of an individual report in Structure mode, click the Structure icon in the bottom-left corner. The Report Manager displays the structure of the first report tab, while keeping the WYSIWYG format in the Report window, as shown in Figure 16-7. Notice that this report has one main section. Within the main section, there are two blocks (a table and a chart) and one cell that contains the picture of the wine glass. The Map view shows the different block types of table, chart, and crosstab with unique icons and names. As you select each report component within Report Manager, BusinessObjects highlights the corresponding component within the Report window. This feature is excellent for formatting different report components. Within Report Manager, Map mode, you can right-click any component to call a pop-up menu with various formatting functions. Map mode also makes it clear which components belong to a block or to a section: note that within the chart block, there is a title, but it belongs to the individual chart and not the entire report; if you delete the chart, you delete the title as well.
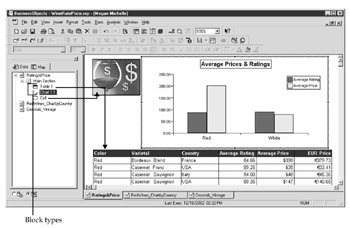
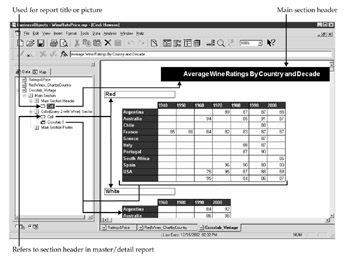
Figure 16-7: In Map mode, Report Manager allows you to view the structure of a document while simultaneously viewing the WYSIWYG format in the Report window.
Recall from the earlier discussion of sections that a master/detail report adds a subsection to the main section. This is more apparent when using Report Manager to view the structure, as shown in the following screen. The subsection name is based on a dimension variable for which you want a separate block (table, chart, crosstab); in this example, Color Section. Within the Color section there is a master cell that contains the contents for each new color; there is also a crosstab or details for each new color. In the Report window, you see two section cells and two crosstab reports, for Red and White; in the structure, there is only one “placeholder,” regardless of how many different dimension values may exist for the master cell.
|
| < Day Day Up > |
|
EAN: 2147483647
Pages: 206