| Suppose you wrote your program and made it bulletproof by catching and properly handling all exceptions. Then you run it, and it does not work right. Now what? (If you never have this problem, you can skip the remainder of this chapter.) Of course, it is best if you have a convenient and powerful debugger. Debuggers are available as a part of professional development environments such as JBuilder, VisualAge, or Sun ONE Studio. However, if you use a new version of Java that is not yet supported by development environments, or if you are on a budget or work on an unusual platform, you will need to do a great deal of debugging by the time-honored method of inserting logging statements into your code. Useful Tricks for Debugging Here are some tips for efficient debugging if you have to do it all yourself.  | You can print or log the value of any variable with code like this: System.out.println("x = " + x); or logger.log("x = " + x); If x is a number, it is converted to its string equivalent. If x is an object, then Java calls its toString method. Most of the classes in the Java library are very conscientious about overriding the toString method to give you useful information about the class. This is a real boon for debugging. You should make the same effort in your classes. To get the state of the current object, print the state of the this object. logger.log("Entering loadImage. this = " + this); This code calls the toString method of the current class, and you get a printout of all instance fields. Of course, this approach works best when the toString method does a conscientious job and reports the values of all data fields. One seemingly little-known but very useful trick is that you can put a separate main method in each class. Inside it, you can put a unit test stub that lets you test the class in isolation. public class MyClass { methods and fields . . . public static void main(String[] args) { test code } } Make a few objects, call all methods, and check that each of them does the right thing. You can leave all these main methods in place and call the Java interpreter separately on each of the files to run the tests. When you run an applet, none of these main methods are ever called. When you run an application, the Java interpreter calls only the main method of the startup class. You can get a stack trace from any exception object with the printStackTrace method in the Throwable class. The following code catches any exception, prints the exception object and the stack trace, and rethrows the exception so it can find its intended handler. try { . . . } catch (Throwable t) { t.printStackTrace(); throw t; } You don't even need to catch an exception to generate a stack trace. Simply insert the statement Thread.dumpStack(); anywhere into your code to get a stack trace. Normally, the stack trace is displayed on System.out. You can send it to a file with the void printStackTrace(PrintWriter s) method. Or, if you want to log or display the stack trace, here is how you can capture it into a string: StringWriter out = new StringWriter(); new Throwable().printStackTrace(new PrintWriter(out)); String trace = out.toString(); (See Chapter 12 for the PrintWriter and StringWriter classes.) It is often handy to trap program errors in a file. However, errors are sent to System.err, not System.out. Therefore, you cannot simply trap them by running java MyProgram > errors.txt In UNIX, this is not a problem. For example, if you use bash as your shell, simply capture the error stream as java MyProgram 2> errors.txt To capture both System.err and System.out in the same file, use java MyProgram 2>&1 errors.txt Some operating systems (such as Windows 95 or 98) do not have such a convenient method. Here is a remedy. Use the following Java program: import java.io.*; public class Errout { public static void main(String[] args) throws IOException { Process p = Runtime.getRuntime().exec(args); BufferedReader err = new BufferedReader(new InputStreamReader(p.getErrorStream())); String line; while ((line = err.readLine()) != null) System.out.println(line); } } Then run your program as java Errout java MyProgram.java > errors.txt | A more efficient way of getting the same result in Windows is to compile this C program into a file errout.exe: #include <io.h> #include <stdio.h> #include <process.h> int main(int argc, char* argv[]) { dup2(1, 2); /* make stderr go to stdout */ execvp(argv[1], argv + 1); return 0; } Then you can run: errout java MyProgram.java > errors.txt |
To watch class loading, run the java interpreter with the -verbose flag. You get a printout such as: [Opened C:\PROGRAM FILES\JAVASOFT\JRE\1.3\lib\rt.jar] [Opened C:\PROGRAM FILES\JAVASOFT\JRE\1.3\lib\i18n.jar] [Opened C:\PROGRAM FILES\JAVASOFT\JRE\1.3\lib\sunrsasign.jar] [Loaded java.lang.Object from C:\PROGRAM FILES\JAVASOFT\JRE\1.3\lib\rt.jar] [Loaded java.io.Serializable from C:\PROGRAM FILES\JAVASOFT\JRE\1.3\lib\rt.jar] [Loaded java.lang.Comparable from C:\PROGRAM FILES\JAVASOFT\JRE\1.3\lib\rt.jar] [Loaded java.lang.String from C:\PROGRAM FILES\JAVASOFT\JRE\1.3\lib\rt.jar] [Loaded java.lang.Class from C:\PROGRAM FILES\JAVASOFT\JRE\1.3\lib\rt.jar] [Loaded java.lang.Cloneable from C:\PROGRAM FILES\JAVASOFT\JRE\1.3\lib\rt.jar] [Loaded java.lang.ClassLoader from C:\PROGRAM FILES\JAVASOFT\JRE\1.3\lib\rt.jar] ... This can occasionally be helpful to diagnose class path problems. If you ever looked at a Swing window and wondered how its designer managed to get all the components to line up so nicely, you can spy on the contents. Press CTRL+SHIFT+F1, and you get a printout of all components in the hierarchy: FontDialog[frame0,0,0,300x200,layout=java.awt.BorderLayout,... javax.swing.JRootPane[,4,23,292x173,layout=javax.swing.JRootPane$RootLayout,... javax.swing.JPanel[null.glassPane,0,0,292x173,hidden,layout=java.awt.FlowLayout,... javax.swing.JLayeredPane[null.layeredPane,0,0,292x173,... javax.swing.JPanel[null.contentPane,0,0,292x173,layout=java.awt.GridBagLayout,... javax.swing.JList[,0,0,73x152,alignmentX=null,alignmentY=null,... javax.swing.CellRendererPane[,0,0,0x0,hidden] javax.swing.DefaultListCellRenderer$UIResource[,-73,-19,0x0,... javax.swing.JCheckBox[,157,13,50x25,layout=javax.swing.OverlayLayout,... javax.swing.JCheckBox[,156,65,52x25,layout=javax.swing.OverlayLayout,... javax.swing.JLabel[,114,119,30x17,alignmentX=0.0,alignmentY=null,... javax.swing.JTextField[,186,117,105x21,alignmentX=null,alignmentY=null,... javax.swing.JTextField[,0,152,291x21,alignmentX=null,alignmentY=null,... If you design your own custom Swing component, and it doesn't seem to be displayed correctly, you'll really love the Swing graphics debugger. And even if you don't write your own component classes, it is instructive and fun to see exactly how the contents of a component are drawn. To turn on debugging for a Swing component, use the setDebugGraphicsOptions method of the JComponent class. The following options are available: DebugGraphics.FLASH_OPTION | Flashes each line, rectangle, and text in red before drawing it | DebugGraphics.LOG_OPTION | Prints a message for each drawing operation | DebugGraphics.BUFFERED_OPTION | Displays the operations that are performed on the offscreen buffer | DebugGraphics.NONE_OPTION | Turns graphics debugging off |
We have found that for the flash option to work, you must disable "double buffering," the strategy used by Swing to reduce flicker when updating a window. The magic incantation for turning on the flash option is: RepaintManager.currentManager(getRootPane()) .setDoubleBufferingEnabled(false); ((JComponent)getContentPane()) .setDebugGraphicsOptions(DebugGraphics.FLASH_OPTION); Simply place these lines at the end of your frame constructor. When the program runs, you will see the content pane filled in slow motion. Or, for more localized debugging, just call setDebugGraphicsOptions for a single component. Control freaks can set the duration, count, and color of the flashes see the online documentation of the DebugGraphics class for details. If you run the Java interpreter with the -Xprof flag, it runs a rudimentary profiler that keeps track of the methods in your code that were executed most often. The profiling information is sent to System.out. The output also tells you which methods were compiled by the just-in-time compiler.
|
 The -X options of the compiler are not officially supported and may not be present in all versions of the SDK. Run java -X to get a listing of all nonstandard options. |
Using a Console Window If you run an applet inside a browser, you may not be able to see any messages that are sent to System.out. Most browsers will have some sort of Java Console window. (Check the help system for your browser.) For example, Netscape Navigator has one, as does Internet Explorer 4 and above. If you use the Java Plug-In, check the Show Java Console box in the configuration panel (see Chapter 10). Moreover, the Java Console window has a set of scroll bars, so you can retrieve messages that have scrolled off the window. Windows users will find this a definite advantage over the DOS shell window in which the System.out output normally appears. We give you a similar window class so you can enjoy the same benefit of seeing your debugging messages in a window when debugging a program. Figure 11-4 shows our ConsoleWindow class in action. Figure 11-4. The console window 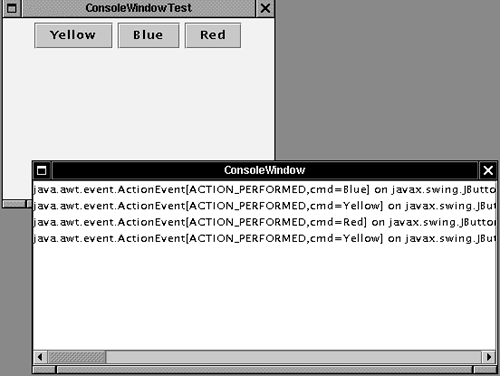
The class is easy to use. Simply call: ConsoleWindow.init() Then print to System.out or System.err in the normal way. Example 11-5 lists the code for the ConsoleWindow class. As you can see, the class is very simple. Messages are displayed in a JTextArea inside a JScrollPane. We call the System.setOut and System.setErr methods to set the output and error streams to a special stream that adds all messages to the text area. (See Chapter 12 for more information on streams.) Example 11-5 ConsoleWindow.java 1. import java.awt.*; 2. import java.awt.event.*; 3. import javax.swing.*; 4. import java.io.*; 5. 6. /** 7. A window that displays the bytes sent to System.out 8. and System.err 9. */ 10. public class ConsoleWindow 11. { 12. public static void init() 13. { 14. JFrame frame = new JFrame(); 15. frame.setTitle("ConsoleWindow"); 16. final JTextArea output = new JTextArea(); 17. output.setEditable(false); 18. frame.getContentPane().add(new JScrollPane(output)); 19. frame.setSize(WIDTH, HEIGHT); 20. frame.setLocation(LEFT, TOP); 21. frame.show(); 22. 23. // define a PrintStream that sends its bytes to the 24. // output text area 25. PrintStream consoleStream = new PrintStream(new 26. OutputStream() 27. { 28. public void write(int b) {} // never called 29. public void write(byte[] b, int off, int len) 30. { 31. output.append(new String(b, off, len)); 32. } 33. }); 34. 35. // set both System.out and System.err to that stream 36. System.setOut(consoleStream); 37. System.setErr(consoleStream); 38. } 39. 40. public static final int WIDTH = 300; 41. public static final int HEIGHT = 200; 42. public static final int LEFT = 200; 43. public static final int TOP = 200; 44. } Tracing AWT Events When you write a fancy user interface in Java, you need to know what events AWT sends to what components. Unfortunately, the AWT documentation is somewhat sketchy in this regard. For example, suppose you want to show hints in the status line when the user moves the mouse over different parts of the screen. The AWT generates mouse and focus events that you may be able to trap. We give you a useful EventTrace class to spy on these events. It prints out all event handling methods and their parameters. See Figure 11-5 for a display of the traced events. Figure 11-5. The EventTracer class at work 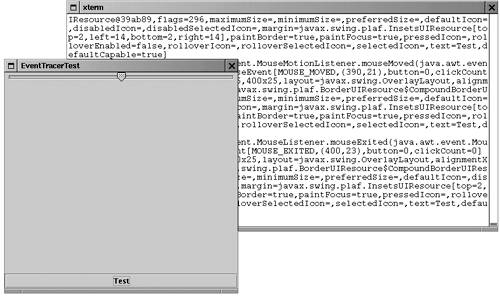
To spy on messages, add the component whose events you want to trace to an event tracer: EventTracer tracer = new EventTracer(); tracer.add(frame); This prints out a textual description of all events, like this: . . . public abstract void java.awt.event.ComponentListener .componentShown(java.awt.event.ComponentEvent):java.awt.event .ComponentEvent[COMPONENT_SHOWN] on frame0 public abstract void java.awt.event.WindowListener .windowOpened(java.awt.event.WindowEvent):java.awt.event .WindowEvent[WINDOW_OPENED] on frame0 . . . You may want to capture this output in a file or a console window, as explained in the preceding sections. Example 11-6 is the EventTracer class. The idea behind the class is easy even if the implementation is a bit mysterious. When you add a component to the event tracer in the add method, the JavaBeans introspection class analyzes the component for methods of the form void addXxxListener(XxxEvent). (See Chapter 7 of Volume 2 for more information on JavaBeans.) For each matching method, an EventSetDescriptor is generated. We pass each descriptor to the addListener method. If the component is a container, we enumerate its components and recursively call add for each of them. The addListener method is called with two parameters: the component on whose events we want to spy, and the event set descriptor. The getListenerType method of the EventSetDescriptor class returns a Class object that describes the event listener interface such as ActionListener or ChangeListener. We create a proxy object for that interface. The proxy handler simply prints the name and event parameter of the invoked event method. The getAddListenerMethod method of the EventSetDescriptor class returns a Method object that we use to add the proxy object as the event listener to the component. This program is a good example of the power of the reflection mechanism. We don't have to hardwire the fact that the JButton class has a method addActionListener whereas a JSlider has a method addChangeListener. The reflection mechanism discovers these facts for us.
 The proxy mechanism makes this program dramatically easier. In prior editions of this book, we needed to define a listener that simultaneously implements the MouseListener, ComponentListener, FocusListener, KeyListener, ContainerListener, WindowListener, TextListener, AdjustmentListener, ActionListener and ItemListener interfaces, and a couple of dozen methods that print the event parameter. The proxy mechanism is explained at the end of Chapter 5. |
Example 11-6 tests the event tracer. The program displays a frame with a button and a slider and traces the events that these components generate. Example 11-6 EventTracer.java 1. import java.awt.*; 2. import java.awt.event.*; 3. import java.beans.*; 4. import java.lang.reflect.*; 5. 6. public class EventTracer 7. { 8. public EventTracer() 9. { 10. // the handler for all event proxies 11. handler = new 12. InvocationHandler() 13. { 14. public Object invoke(Object proxy, 15. Method method, Object[] args) 16. { 17. System.out.println(method + ":" + args[0]); 18. return null; 19. } 20. }; 21. } 22. 23. /** 24. Adds event tracers for all events to which this component 25. and its children can listen 26. @param c a component 27. */ 28. public void add(Component c) 29. { 30. try 31. { 32. // get all events to which this component can listen 33. BeanInfo info = Introspector.getBeanInfo(c.getClass()); 34. 35. EventSetDescriptor[] eventSets 36. = info.getEventSetDescriptors(); 37. for (int i = 0; i < eventSets.length; i++) 38. addListener(c, eventSets[i]); 39. } 40. catch (IntrospectionException exception) {} 41. // ok not to add listeners if exception is thrown 42. 43. if (c instanceof Container) 44. { 45. // get all children and call add recursively 46. Component[] a = ((Container)c).getComponents(); 47. for (int i = 0; i < a.length; i++) 48. add(a[i]); 49. } 50. } 51. 52. /** 53. Add a listener to the given event set 54. @param c a component 55. @param eventSet a descriptor of a listener interface 56. */ 57. public void addListener(Component c, 58. EventSetDescriptor eventSet) 59. { 60. // make proxy object for this listener type and route 61. // all calls to the handler 62. Object proxy = Proxy.newProxyInstance(null, 63. new Class[] { eventSet.getListenerType() }, handler); 64. 65. // add the proxy as a listener to the component 66. Method addListenerMethod 67. = eventSet.getAddListenerMethod(); 68. try 69. { 70. addListenerMethod.invoke(c, new Object[] { proxy }); 71. } 72. catch(InvocationTargetException e) {} 73. catch(IllegalAccessException e) {} 74. // ok not to add listener if exception is thrown 75. } 76. 77. private InvocationHandler handler; 78. } Example 11-7 EventTracerTest.java 1. import java.awt.*; 2. import java.awt.event.*; 3. import javax.swing.*; 4. 5. public class EventTracerTest 6. { 7. public static void main(String[] args) 8. { 9. JFrame frame = new EventTracerFrame(); 10 frame.setDefaultCloseOperation(JFrame.EXIT_ON_CLOSE); 11. frame.show(); 12. } 13. } 14. 15. class EventTracerFrame extends JFrame 16. { 17. public EventTracerFrame() 18. { 19. setTitle("EventTracerTest"); 20. setSize(DEFAULT_WIDTH, DEFAULT_HEIGHT); 21. 22. // add a slider and a button 23. Container contentPane = getContentPane(); 24. 25. contentPane.add(new JSlider(), BorderLayout.NORTH); 26. contentPane.add(new JButton("Test"), BorderLayout.SOUTH); 27. 28. // trap all events of components inside the frame 29. EventTracer tracer = new EventTracer(); 30. tracer.add(this); 31. } 32. 33. public static final int DEFAULT_WIDTH = 400; 34. public static final int DEFAULT_HEIGHT = 400; 35. } The AWT Robot Version 1.3 of Java 2 adds a Robot class that you can use to send keystrokes and mouse clicks to any AWT program. This class is intended for automatic testing of user interfaces. To get a robot, you need to first get a GraphicsDevice object. You get the default screen device through the sequence of calls: GraphicsEnvironment environment = GraphicsEnvironment.getLocalGraphicsEnvironment(); GraphicsDevice screen = environment.getDefaultScreenDevice(); Then you construct a robot as: Robot robot = new Robot(screen); To send a keystroke, tell the robot to simulate a key press and a key release: robot.keyPress(KeyEvent.VK_TAB); robot.keyRelease(KeyEvent.VK_TAB); For a mouse click, you first need to move the mouse and then press and release a button: robot.mouseMove(x, y); robot.mousePress(InputEvent.BUTTON1_MASK); robot.mouseRelease(InputEvent.BUTTON1_MASK); Here x and y are absolute screen pixel coordinates. The idea is that you simulate key and mouse input, and afterwards take a screen snapshot to see whether the application did what it was supposed to. You capture the screen with the createScreenCapture method: Rectangle rect = new Rectangle(x, y, width, height); BufferedImage image = robot.createScreenCapture(rect); The rectangle coordinates also refer to absolute screen pixels. Finally, you usually want to add a small delay between robot instructions so that the application can catch up. Use the delay method and give it the number of milliseconds to delay. For example: robot.delay(1000); // delay by 1000 milliseconds The program in Example 11-8 shows how you can use the robot. A robot tests the button test program that you saw in Chapter 8. First, pressing the space bar activates the left most button. Then the robot waits for two seconds so that you can see what it has done. After the delay, the robot simulates the tab key and another space bar press to click on the next button. Finally, we simulate a mouse click on the third button. (You may need to adjust the x and y coordinates of the program to actually press the button.) The program ends by taking a screen capture and displaying it in another frame. As you can see from this example, the Robot class is not by itself suitable for convenient user interface testing. Instead, it is a basic building block that can be a foundational part of a testing tool. A professional testing tool can capture, store, and replay user interaction scenarios and find out the screen locations of the components so that mouse clicks aren't guesswork. At the time of this writing, the robot is brand new and we are not aware of any sophisticated testing tools for Java user interfaces. We expect these tools to materialize in the future. Example 11-8 RobotTest.java 1. import java.awt.*; 2. import java.awt.event.*; 3. import java.awt.image.*; 4. import javax.swing.*; 5. 6. public class RobotTest 7. { 8. public static void main(String[] args) 9. { 10. // make frame with a button panel 11. 12. ButtonFrame frame = new ButtonFrame(); 13. frame.setDefaultCloseOperation(JFrame.EXIT_ON_CLOSE); 14. frame.show(); 15. 16. // attach a robot to the screen device 17. 18. GraphicsEnvironment environment 19. = GraphicsEnvironment.getLocalGraphicsEnvironment(); 20. GraphicsDevice screen 21. = environment.getDefaultScreenDevice(); 22. 23. try 24. { 25. Robot robot = new Robot(screen); 26. run(robot); 27. } 28. catch (AWTException exception) 29. { 30. System.err.println("Can't construct robot."); 31. } 32. } 33. 34. /** 35. Runs a sample test procedure 36. @param robot the robot attached to the screen device 37. */ 38. public static void run(Robot robot) 39. { 40. // simulate a space bar press 41. robot.keyPress(' '); 42. robot.keyRelease(' '); 43. 44. // simulate a tab key followed by a space 45. robot.delay(2000); 46. robot.keyPress(KeyEvent.VK_TAB); 47. robot.keyRelease(KeyEvent.VK_TAB); 48. robot.keyPress(' '); 49. robot.keyRelease(' '); 50. 51. // simulate a mouse click over the rightmost button 52. robot.delay(2000); 53. robot.mouseMove(200, 50); 54. robot.mousePress(InputEvent.BUTTON1_MASK); 55. robot.mouseRelease(InputEvent.BUTTON1_MASK); 56. 57. // capture the screen and show the resulting image 58. robot.delay(2000); 59. BufferedImage image = robot.createScreenCapture( 60. new Rectangle(0, 0, 400, 300)); 61. 62. ImageFrame frame = new ImageFrame(image); 63. frame.show(); 64. } 65. } 66. 67. /** 68. A frame to display a captured image 69. */ 70. class ImageFrame extends JFrame 71. { 72. /** 73. @param image the image to display 74. */ 75. public ImageFrame(Image image) 76. { 77. setTitle("Capture"); 78. setSize(DEFAULT_WIDTH, DEFAULT_HEIGHT); 79. 80. Container contentPane = getContentPane(); 81. JLabel label = new JLabel(new ImageIcon(image)); 82. contentPane.add(label); 83. } 84. 85. public static final int DEFAULT_WIDTH = 450; 86. public static final int DEFAULT_HEIGHT = 350; 87. } } java.awt.GraphicsEnvironment 1.2  static GraphicsEnvironment getLocalGraphicsEnvironment() returns the local graphics environment. GraphicsDevice getDefaultScreenDevice() returns the default screen device. Note that computers with multiple monitors have one graphics device per screen use the getScreenDevices method to obtain an array of all screen devices.
|
java.awt.Robot 1.3 Robot(GraphicsDevice device) constructs a robot that can interact with the given device. void keyPress(int key) void keyRelease(int key) simulate a key press or release. Parameters: | key | The key code. See the KeyStroke class for more information on key codes. |
void mouseMove(int x, int y) simulates a mouse move. Parameters: | x, y | The mouse position in absolute pixel coordinates |
void mousePress(int eventMask) void mouseRelease(int eventMask) simulate a mouse button press or release. Parameters: | eventMask | The event mask describing the mouse buttons. See the InputEvent class for more information on event masks. |
void delay(int milliseconds) delays the robot for the given number of milliseconds. BufferedImage createScreenCapture(Rectangle rect) captures a portion of the screen. Parameters: | rect | The rectangle to be captured, in absolute pixel coordinates |
|
Profiling You may have a program that works correctly but is too slow to be useful. Of course, before you rewrite the program, you want to know why it is too slow. This is not something that you should leave to guesswork. It is not uncommon for even experienced programmers to guess wrong, spend time optimizing a part of the code that doesn't get executed all that often, and still have a poorly performing program. Instead, you should turn to a profiler. The Java 2 SDK includes a very rudimentary profiling tool called HPROF that is really just a proof of concept, not a serious tool. More importantly, the JVM includes a profiler interface that tool vendors can use to build sophisticated profiling tools. For more information on the JVM profiler interface, see http://java.sun.com/products/jdk/1.3/docs/guide/jvmpi/jvmpi.html. HPROF is an example of a program that utilizes the JVM profiler interface. Other, more powerful profiling tools are available commercially. To run the profiler on a program, use the following command line: java -Xrunhprof:option1=value1,option2=value2,... MyProg Table 11-4 shows the profiler options. Table 11-4. HPROF optionsOption Name and Value | Description | Default |
|---|
cpu=samples|times | CPU usage | None | heap=dump|sites|all | Heap profiling | all | monitor=y|n | Monitor contention | n | format=a|b | Text (ASCII) or binary | a | file=name | Write data to file | java.hprof.txt for text, java.hprof for binary | net=host:port | Send data to socket | Write to file | depth=size | Stack trace depth | 4 | cutoff=value | Output cutoff point | 0.0001 | lineno=y|n | Line number in traces? | y | thread=y|n | Thread in traces? | n | doe=y|n | Dump on exit? | y |
The cpu and heap options are the most useful ones. The cpu=samples option periodically samples the runtime stacks of all threads, and tracks how often a particular stack frame was captured. You'll see an example later in this section. The cpu=times option tracks when each method was entered and exited. The heap=sites option tracks object allocations and deallocations. Let us look at an example. The program in Example 11-9 is a simple word count program, just like the UNIX wc utility. It counts the number of lines, words, and characters in System.in. For example, to count words in jdk/README.txt, you would execute java WordCount < jdk/README.txt The WordCount program is very simple. It reads input a line at a time, using the BufferedReader.readLine method. To count the characters, we simply print the length of the input string. To count the words, we use the countTokens method of the StringTokenizer class. (See Chapter 12 for more information on the BufferedReader and StringTokenizer classes.) The program works correctly, but it is extremely slow on larger files. Counting the words in the full text of "Alice in Wonderland" (28195 words in about 150K bytes) takes 80 seconds on our test machine, whereas the wc program does the same job in less than a second. Of course, with a simple program like this, it is not difficult to spot the reason for the poor performance. But let us nevertheless run the profiler to see our suspicions verified. You may want to have a guess before looking at the numbers. Clearly, concatenating the input to a long string is wasteful and unnecessary. How about the string tokenizer? Is it inefficient to count tokens? Run the profiler as java -Xrunhprof:cpu=samples WordCount < gutenberg/alice30.txt By default, the profiler sends its output to the file java.hprof.txt. You can change the output file with the file option. Open the file and look at the very end, in the CPU SAMPLES section. The section starts out like this: rank self accum count trace method 1 37.23% 37.23% 1246 3 java.lang.StringBuffer.expandCapacity 2 32.24% 69.47% 1079 10 java.lang.StringBuffer.expandCapacity 3 28.56% 98.03% 956 6 java.lang.String.getChars 4 0.30% 98.33% 10 17 WordCount.main 5 0.21% 98.54% 7 7 java.lang.StringBuffer.toString 6 0.18% 98.72% 6 20 WordCount.main 7 0.15% 98.86% 5 4 java.io.BufferedReader.readLine 8 0.15% 99.01% 5 16 java.lang.String.<init> 9 0.12% 99.13% 4 11 java.lang.StringBuffer.append 10 0.12% 99.25% 4 13 WordCount.main . . . To interpret this table, you need to match up the entries in the trace column with the TRACE listings earlier in the output. The listings appear in seemingly random order. Here are the ones that match up the three top-ranked entries in the CPU samples: TRACE 3: java.lang.StringBuffer.expandCapacity(StringBuffer.java:202) java.lang.StringBuffer.append(StringBuffer.java:401) WordCount.main(WordCount.java:18) TRACE 10: java.lang.StringBuffer.expandCapacity(StringBuffer.java:Unknown line) java.lang.StringBuffer.append(StringBuffer.java:401) WordCount.main(WordCount.java:18) TRACE 6: java.lang.String.getChars(String.java:Unknown line) java.lang.StringBuffer.append(StringBuffer.java:402) WordCount.main(WordCount.java:18) As you can see, they all happen to point to the same line of source code, namely line 18: input += line; You may wonder why there are two identical-looking stack traces. To solve this mystery, run the javap decompiler: javap -c -l WordCount The code for line 18 is: 48 new #8 <Class java.lang.StringBuffer> 51 dup 52 invokespecial #9 <Method java.lang.StringBuffer()> 55 aload_1 56 invokevirtual #10 <Method java.lang.StringBufferappend- (java.lang.String)> 59 aload 4 61 invokevirtual #10 <Method java.lang.StringBufferappend- (java.lang.String)> 64 invokevirtual #12 <Method java.lang.String toString()> 67 astore_1 In other words, the compiler translates input += line; into StringBuffer temp = new StringBuffer(); temp.append(input); temp.append(line); input = temp.toString(); As you can see, there are two calls to the append method, and apparently each of them is time-consuming. Of course, this problem is easy to fix. There is no need to concatenate all input. Simply count the number of characters and words separately for each input line, and the program will run about as fast as the native UNIX program. In addition to timing data, the HPROF program can also show you heap allocations. For example, run the command java -Xrunhprof:heap=sites WordCount < alice30.txt The output starts with rank self accum bytes objs bytes objs trace name 1 65.49% 65.49% 398250 3 477753252 7703 468 [C 2 24.59% 90.08% 149524 157 149524 157 1 [I 3 3.17% 93.25% 19282 739 19478 755 1 [C . . . This means that stack trace 468 allocated a huge number of character arrays ([C). The stack trace is TRACE 468: java.lang.StringBuffer.expandCapacity(StringBuffer.java:202) java.lang.StringBuffer.append(StringBuffer.java:401) WordCount.main(WordCount.java:18) It again points to the infamous line 18. This section showed you how you can use the information that the HPROF program generates to find trouble spots in your program. However, in a larger program, the HPROF output is going to be unwieldy, and you should use a professional profiling tool. Example 11-9 WordCount.java 1. import java.io.*; 2. import java.util.*; 3. 4. /** 5. A program for counting the count of lines, words, 6. and sentences in System.in 7. */ 8. public class WordCount 9. { 10. public static void main(String[] args) 11. { 12. String input = ""; 13. int lines = 0; 14. try 15. { 16. BufferedReader reader = new BufferedReader(new 17. InputStreamReader(System.in)); 18. String line; 19. // read input lines until the end of file is reached 20. while ((line = reader.readLine()) != null) 21. { 22. line += "\n"; 23. input += line; // add line to input string 24. lines++; // increment line count 25. } 26. } 27. catch (IOException exception) 28. { 29. exception.printStackTrace(); 30. } 31. 32. // split the input into tokens to count all words 33. StringTokenizer tokenizer = new StringTokenizer(input); 34. int words = tokenizer.countTokens(); 35. 36. // print count of lines, words, and characters in input 37. System.out.println(lines + " " + words 38. + " " + input.length()); 39. } 40. } Coverage Testing The J2SE SDK contains a coverage testing tool called JCOV. During coverage testing, you measure which code in your program has been executed during test runs. After all, if your test cases never execute a particular code branch, it is entirely possible that undetected errors are lurking there. JCOV is even more primitive than HPROF, and we will describe it only briefly. For example, to track which methods are used in a particular run of the OptionPaneTest program of Chapter 9, run java -Xrunjcov:type=M OptionDialogTest The JCOV tool stores the coverage analysis in a file named java.jcov. Here is a typical output: JCOV-DATA-FILE-VERSION: 2.0 CLASS: ButtonPanel [] SRCFILE: OptionDialogTest.java TIMESTAMP: 0 DATA: M #kind line position count METHOD: getSelection()Ljava/lang/String; [] 1 60 0 8 METHOD: <init>(Ljava/lang/String;[Ljava/lang/String;)V [public] 1 36 0 6 CLASS: OptionDialogFrame$ShowAction [] SRCFILE: OptionDialogTest.java TIMESTAMP: 0 DATA: M #kind line position count METHOD: actionPerformed(Ljava/awt/event/ActionEvent;)V [public] 1 233 0 2 METHOD: <init>(LOptionDialogFrame;)V [private] 1 229 0 1 METHOD: <init>(LOptionDialogFrame;LOptionDialogFrame$1;)V [] 1 229 0 1 CLASS: OptionDialogTest [public] SRCFILE: OptionDialogTest.java TIMESTAMP: 0 DATA: M #kind line position count METHOD: main([Ljava/lang/String;)V [public static] 1 17 0 1 METHOD: <init>()V [public] 1 13 0 0 For example, the <init> method of the ButtonPanel was executed six times, to construct six panels. The default constructor of the OptionDialogTest class was not executed at all that makes sense since we never instantiated the class and called only the static main method. For more help on JCOV, run java -Xrunjcov:help and look at the file jvm.jcov.txt in the jre/lib directory. The JCOV tool, just like HPROF, is more a proof of concept than a usable tool. Professional profiling tools give you coverage analysis in a format that is easier to interpret. |
