5.5.1 Problem Your code is stopped at a breakpoint, and you want to execute it line by line, or until it encounters the next breakpoint. 5.5.2 Solution Use the code-stepping options available via toolbar buttons , menu items, or keyboard shortcuts. 5.5.3 Discussion The most basic way to move through paused code is by single-stepping . Eclipse gives you four main options here, corresponding to the four arrow buttons in the Debug view toolbar, beginning with the double-headed arrow and moving to the right (these items also are accessible in the Run menu when you're paused in a debugging session): -
- Step With Filters (also Shift-F5)
-
Steps into the selected statement using predefined filters, or filters you've created. If the statement you're stepping into is a method call, execution continues inside the called method unless you've filtered out the method. -
- Step Into (also F5)
-
Steps into the selected statement. If that statement is a method call, execution continues inside the called method. -
- Step Over (also F6)
-
Steps over the selected statement. Does not step into method calls. -
- Step Return (also F7)
-
Executes until the end of the current method and then returns, pausing after the method returns (or when a breakpoint is encountered ). In our example, clicking the Step Into button makes the debugger move to the next line of executable code. Because we were paused at the line if(loopIndex == 0) in the previous recipe, and because loopIndex is equal to 3 , not , the body of the if statement is not executed. Instead, we move to the next iteration of the enclosing for loop, as shown in Figure 5-11.  | Note the display in the Debug view at upper left, which displays your location in the code. Here, we're executing code in the main thread, and we are in the DebugClass.main stack frame (stack frames are marked by icons composed of three horizontal bars). Knowing where you are in a stack frame is very useful when the code you're debugging contains many levels of method calls. To resume debugging in any stack frame, just select that stack frame in the Debug view. | |
Figure 5-11. Single-stepping through code 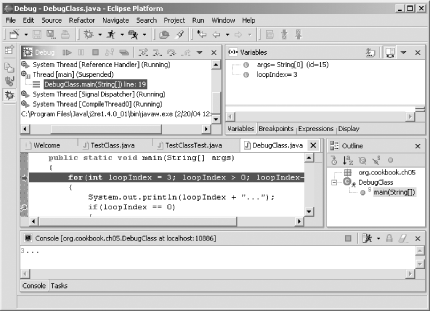
When you're stepping through your code, you also can use step filters , which enable you to specify code to avoid (or to filter out) while single-stepping. For example, filtering out the code in a class or package means you won't step through that code when you select Step With Filters. You can set step filters by selecting Window  Preferences Java Debug Step Filtering, as shown in Figure 5-12. If you want to filter out code, use the checkboxes next to the predefined filters you see in the figure, or create a new filter by clicking the Add Filter button. Preferences Java Debug Step Filtering, as shown in Figure 5-12. If you want to filter out code, use the checkboxes next to the predefined filters you see in the figure, or create a new filter by clicking the Add Filter button. Figure 5-12. Specifying step filters 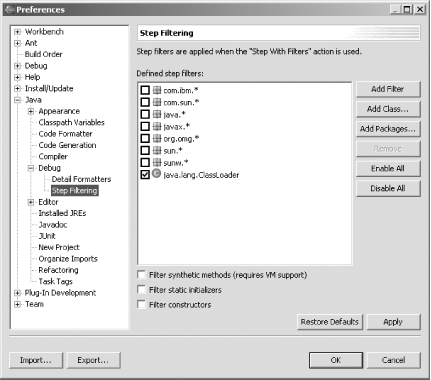
Stepping through code line by line is fine when you don't have a lot of code. But if you are debugging a few hundred lines of code, you need something faster. In that case, take a look at Recipe 5.6 on running until a breakpoint is encountered. 5.5.4 See Also Recipe 5.3 on starting a debugging session; Recipe 5.4 on setting a breakpoint; Recipe 5.6 on running until hitting a breakpoint; Chapter 3 of Eclipse (O'Reilly). |