| Up until now we have only discussed simple DataSets with one table. We have done this to keep our examples simple for the purpose of demonstrating the XML roots of the DataSet. This belies the power of the DataSet. The true power lies in its ability to define multiple tables and to define relationships between them. In ADO, you could accomplish this with the data-shaping commands and the multidimensional ADO objects. If any of you ever tried to do this, you were up against an arcane language invented by a computer scientist from hell. I never used it and I am not afraid of arcane languages. I just didn't have the time to learn the weird syntax. Doing the same thing in ADO .NET is not nearly as mystifying. If you've ever created a master-detail table structure in Microsoft Access or SQL Server you already know how to do this. We will use the Customers, Orders, and Order Details tables in the Northwind database to demonstrate how to create a master-detail form. We will keep it simple at first by using a grid control. The grid control has some very nice features for visually presenting master-detail data without having to write very much code. Once we demonstrate this using the grid, we will create a more complex form and show how to use some code to make the data even more presentable. The first step in creating our form is to create the visual design. We will use our familiar paradigm for starters. If you wish you can copy the form from the previous project and rename it. Set up your form with the grid and add one more button to enable us to read the data from the database. Next , add three SqlDataAdapters. When you add the first DataAdapter, the wizard will also add a Connection object as well. Make sure you select the Northwind database. Each DataAdapter should support accessing one of the three tables, Customer, Orders, and Order Details. These tables have a natural master-detail hierarchy to them. When you get to the point in the wizard where it asks you to supply the Select statement, use the Query Builder to create a standard select for each of the three tables. Don't use the Select * From Customers syntax. Select each column separately. After the DataAdapters are configured, let's create our DataSet. We will be using a typed DataSet. It is possible to use an untyped one and set everything up in code, but by using a typed DataSet we enable the code to be reused in other applications and it makes the demonstration easier to understand. Drag a DataSet from the toolbox onto the component area. The wizard should open . Select Typed DataSet and change the name of the DataSet to dsOrders. Make sure all three tables are checked in the list and click OK. See Figure 7.16. Figure 7.16. Generating a multitable DataSet.  Now we must create the relationships between the tables. The DataSet cannot inherit the relations from the database as of this release. Maybe it will be a future enhancement, but for now we have to create them manually. Right-click on dsOrders1 and select View Schema. This will open a database diagram of the DataSet. You should see the three tables laid out for you. To create the relation, drag the column from the parent table across to the child table and drop it on the corresponding column. For the CustomersOrders relation you will drag the CustomerID from the Customers table and drop it on the CustomerID in the Orders table. When you drop the column, the Edit Relation dialog opens (see Figure 7.17). Figure 7.17. The Edit Relation dialog.  Make sure you drag the column the correct direction. If you drag it from Orders to Customers you will get a different relationship. Repeat this process for the Orders-Order Detail relation. This time drag the OrderID from the Orders table to the Order Detail table. When you have finished, your diagram should look something like Figure 7.18. We call this an Entity-Relationship or E-R diagram. Figure 7.18. E-R diagram of dsOrders1.  Once we have created our DataSet, we can bind it to the grid control. Set the DataSource property of the grid control to dsOrders1. Next, set the DataMember property to the Customers table. By setting the DataMember property, we are telling the grid control which table to display initially. Now we have to create some code to read the database and populate the DataSet. Add this code to the Button4_Click event procedure: Private Sub Button4_Click(ByVal sender As System.Object, ByVal e As System.EventArgs) Handles Button4.Click Try SqlDataAdapter1.Fill(DsOrders1.Customers) SqlDataAdapter2.Fill(DsOrders1.Orders) SqlDataAdapter3.Fill(DsOrders1.Order_Details) Catch errobj As Exception MsgBox(errobj.Message) End Try End Sub We should now be ready to run the project. When the screen opens, click the Read Data button. The grid should populate with the contents of the Customers table as in Figure 7.19. Figure 7.19. The project populated with data. 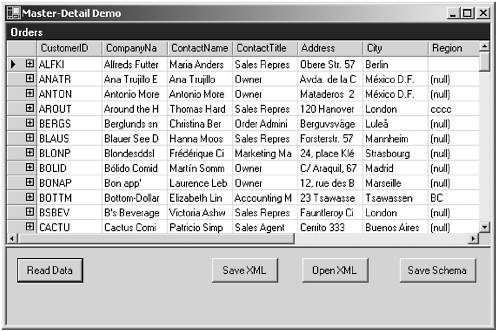 The only things different are the plus boxes in the indicator column. In a tree control, this means that we can expand the node. It means the same thing with the grid. If we click one of the plus boxes, we will have the option of drilling down through the levels of detail (see Figure 7.20). Figure 7.20. Plus box clicked.  If we then select the hyperlink (it's not really a hyperlink, it just looks like one), we will now display all the orders for BLONP. The master or parent row moves to the header of the grid as in Figure 7.21. Figure 7.21. Showing the customer's orders. 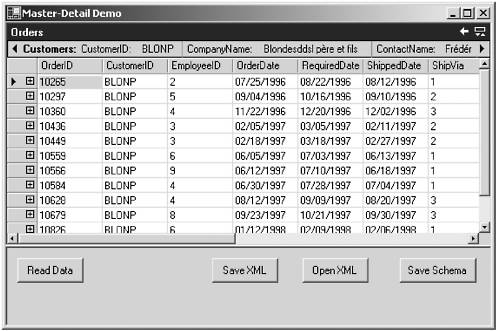 Likewise, we can also drill down to the line items of each order using the same technique. When there are no more levels to drill into, the plus boxes disappear. See Figure 7.22. Figure 7.22. Showing the order detail.  Notice that the order header information also now appears in the grid header. You can use the arrows in the header to scroll left and right to reveal the full record. The right arrow in the caption header brings you back up to the next level. The other icon allows you to show and hide the parent row display. Pretty good for writing a minimum of code, wouldn't you say? Controlling Grid Navigation Programmatically Next we will create a more sophisticated form so we can demonstrate how to use code to show the details. In our new form, we will display the customer information in a header panel we will create ourselves . Then we will add a Next and a Previous button for the user to navigate through the customers. As the user navigates, the grid control will automatically display the order information for the customer. We can use the same DataSet (dsOrders1) that we have been using. Our new form will appear as in Figure 7.23. Figure 7.23. The form with the new header.  We want to add a new procedure to the form to assist with positioning the data grid. This new procedure will be called SetRowPos and will accept the row position as a parameter. Private Sub SetRowPos(ByVal intPos As Integer) DataGrid1.NavigateBack() Me.BindingContext(DsOrders1, "Customers").Position = intPos DataGrid1.NavigateTo(intPos, "CustomersOrders") End Sub All navigation in the grid is relative to the row on which you are currently positioned. The grid does not have any waythat I can tellof informing the programmer of what level is currently the relation that is displayed on the screen. This would be a nice feature for a future revision.  | 