Overview of IEV and Security Monitor
| Intrusion Detection Event Viewer (IEV) is a Windows program that you can download for free from Cisco.com and can install on your own desktop. You then need to configure it to connect to the sensor and pull alarms from the sensor. You can download the latest version of IEV from the following location: http://www.cisco.com/cgi-bin/tablebuild.pl/ids-ev As mentioned before, IEV is limited to pulling events from three sensors only, and doesn't have the syslog capability. So, if you have more than three sensors, or need syslog along with IDS sensor reporting capability, then you need to have the Security Monitor. Security Monitor consists of a Web-based application with command line utilities for pruning and archiving the data in the database and Perl script files, which can be run through the notifier for notification purposes. Many of the components of the Web-based application run as services on Windows and are managed as daemons by the daemon manger. The primary functions of Security Monitor include:
When installed on the same server, to IDS/IPS MC and the Security Monitor share many components, including database tables and Java objects. The Event Viewer periodically polls events from the database. The polling rate is adjustable and affects the amount of delay that users will experience between when an event is received until it is displayed in the viewer. There are tradeoffs between how often the data is refreshed by the event viewer and the overall efficiency of the system. The performance of the Security Monitor varies considerably with system resources. The default pruning rules are tuned to a system that meets the Bundle Hardware requirements. Systems with more resources may be able to adjust these rules to store more data before pruning. You can filter event data three ways:
Similar to Event Rules, Database Rules also send notifications. But they are based on the state of the database. The database state is periodically monitored and compared to the trigger condition of stored rules. When a rule triggers, it sends notifications. For example, a script notification runs default pruning when one of the default pruning rules triggers by default on Security Monitor. There are three ways in which notifications can be triggered:
The notification can be sent in the following ways:
Communication ArchitectureCommunication protocols between the Security Monitor and the reporting devices depend on the types of reporting devices. The Security Monitor is supported by the following list of protocols:
How Does It Work?As discussed previously, different monitoring devices use different types of protocols to forward events. For instance, IDS 3.x uses PostOffice for the communication, and pushes the events from the sensor to the Security Monitor, whereas in IDS 4.x, RDEP is used where Security Monitor makes the connection with the sensor and pulls the events over https (Secure Sockets LayerSSL). In IPS version 5.0, Security Monitor uses SDEE as the communication protocol. Because IDS 4.x and IPS 5.x are the most frequently used monitoring devices for Security Monitor, this section explains the deeper details of how Security Monitor pulls the events from the sensor. For other devices (such as syslog from router), the mechanism is slightly different. Figure 22-1 shows the system flow of Security Monitor with IDS 4.x sensor. Figure 22-1. System Flow of Security Monitor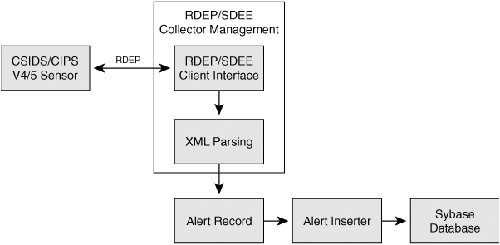 Following is a brief sequential discussion of every component required to pull the events from the sensor and insert them into the Security Monitor database. RDEP/SDEE Collector ManagementThe RDEP/SDEE Collector Manager manages connection status, event retrieval subscriptions, and metrics. Items are added or deleted for monitoring by their placement in the monitored_devices table. A separate RDEP/SDEE Collector object is used for each CSIDS v4 or CSIPS v5 sensor listed in the monitored_devices table. When a device is added to the table to be monitored, the collector opens an RDEP/SDEE connection to the sensor, starts a subscription and begins pulling alert data out from the sensor through the subscription. The alert data is parsed and inserted into the alerts table in the database. The RDEP/SDEE Collector manager keeps track of the timestamp and id of the last alert inserted. Knowing the id and timestamp allows the RDEP/SDEE collector to restart a subscription at a known location. You can specify a minimum alarm level to be retrieved from the CSIDS v4 or CSIPS v5 sensor. The information for the minimum alarm level is specified in the GUI and passed to the receiver through the monitored_devices table. The RDEP/SDEE collector continually pulls alerts from the sensor and sends them to the XML parser for insertion into the database. This continues as long as the device remains in the monitored_devices table and the device is connected. If the device is deleted from the monitored_devices table, the subscription is closed and the RDEP/SDEE collector disconnects from the sensor. If the connection goes down but the device is still in the monitored_devices table, the RDEP/SDEE collector attempts to open a new RDEP/SDEE connection to the sensor and re-attach it to the previously opened subscription. If the previous subscription is not valid, a new one is started using the timestamp of the last received event. If the reconnect attempt fails, the RDEP/SDEE collector logs the error in the Audit Log and sleeps for a second before attempting to connect again. This will continue until the device is removed from the table. If there is a Network Address Translation (NAT) device between the sensor and the Security Monitor, then the NAT address for the CSIDS v4 or CSIPS v5 sensor is used for connection to the sensor. The NAT address is also the address stored in the alert record in the database ALERT_TABLE in the sensor IP address field. Connection StatusThe connection status with the sensor is monitored by the RDEP/SDEE Manager. A device is considered to be Connected if the last attempt to read through the connection succeeded. A device will be marked as Not Connected if the last read attempt failed. Connection status is stored in the database for access by the GUI. It will be updated dynamically by the RDEP/SDEE Collector. Table 22-1 explains the meaning of different connection statuses.
How Often Does Security Monitor Poll a Sensor?The Security Monitor issues requests to RDEP/SDEE sensors at different rates at different times. When the collector first starts up, it builds the subscription and issues the initial get request (usually within a few seconds of placing the device in the monitored device table). The initial request asks for all events of the specified severity that are detected by the sensor from this point forward. The RDEP/SDEE sensor responds within 10 seconds with either an empty response (if no events have appeared) or with a document that includes up to 100 events (the maximum number of events retrieved with one get request). If the Security Monitor receives data in the initial request, it turns around and issues a new request immediately. If the initial request is empty, the Security Monitor delays one second before issuing the next request. When that response comes back, the Security Monitor issues a new request. If two empty requests are received in a row, the delay between requests is doubled. If the request contains data, a new request is issued immediately. The process continues in this manner with each successive empty response doubling the delay between requests, up to a maximum of five minuteswhenever a non-empty response is received, the next request is issued immediately and the process starts over. One other thing complicates this process a bit. After the first request, the subscription timeout (the length of time the sensor waits for incoming data before returning the response) is set to 30 seconds. So the request turnaround time for an empty response is the delay between request and 30 seconds. This process ensures the following:
XML ParsingThe purpose of the XML parser is to parse a valid XML document that is received from the sensor to the Inserter to insert the information into the database. If the XML document is not valid, the parser will show an error. If the document is valid, it will be parsed. All required fields from the IDIOM Schema Specification must be present in the evAlert. If a required field is not present, there will be an error. Alert InserterThe purpose of the Alert Inserter is to write the alert to the database upon receiving the XML parsed data. This is done with an SQL statement and built into the Inserter; hence no user intervention is required. IDS/IPS MC and Security Monitor ProcessesThere is a set of processes that manage the tasks that IDS/IPS MC and Security Monitor perform. If one of those processes is not running, the function they are responsible for will not work. If there are problems in running the application, it is always a good practice to check that all those processes are running. The processes and their main functions are the following:
If any of those processes is not running, the related task will not be performed. To check the status of the processes and start them, go to Server Configuration > Administration > Process Management. From there you can view the status of the processes, stop the processes, or start stopped processes. All the processes that start with IDS_ are related to Security Monitor or IDS/IPS MC. To identify the devices that are supported by different versions of Security Monitor, check this site: http://www.cisco.com/en/US/products/sw/cscowork/ps3991/products_device_support_tables_list.html Following are some of the important points about supportability:
User Management for Security MonitorYou can create users for one of the following privileges for the Security Monitor:
|
EAN: 2147483647
Pages: 190