Using JMeter to Test a Web Application Navigation
In this example, we'll set up a ThreadGroup, add Web-test controllers to the ThreadGroup, set up a timer, and set up a graph listener. We follow these steps:
-
Start JMeter. After installing JMeter, you will see a directory called bin in the JMeter home directory. Go to bin and type "jmeter"; this script will work under Unix and Windows because the makers of JMeter created both types of start-up scripts.
-
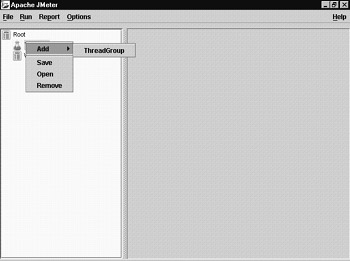
We'll add a ThreadGroup to the TestPlan. Right-click on the TestPlan node, select Add, and select ThreadGroup from the pop-up menu:
-
Expand the TestPlan node and select the ThreadGroup node. Note that the number of threads is set to 1. Although one thread is not a realistic load test, it's great when we are developing a test. We don't want to launch 100 simulated users (threads) when we don't know if our TestPlan works.
-
Change the name of the ThreadGroup to Navigation, because we're going to set up this type of test.
-
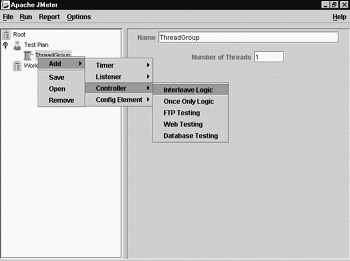
In order for the test to do something, we need to add a controller. Right-click the ThreadGroup node and add a WebTesting Controller, as shown here:
-
We need to configure the Web-testing controller. We will set up several Web-testing controllers to simulate navigating down the Web application from the home page to the product page of the pet store sample application. Set up the first controller as follows :
-
Set the name to HomeWebTest.
-
Set the domain to localhost (or wherever petstore is running).
-
Set the port to 80, which is the default (or whatever port the Web application server is set to run on).
-
Set the path to pet (as in http://localhost/pet ).
-
-
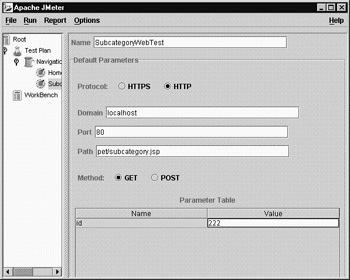
Set up the ability to access the subcategory , as in http://localhost/pet/subcategory.jsp?id=222 . Add another Web-testing controller as follows:
-
Set the name to SubcategoryWebTest.
-
Set the domain to localhost.
-
Leave the port at 80.
-
Set the path to pet/subcategory.jsp (as in http://localhost/pet/subcategory.jsp?id=222 ).
-
-
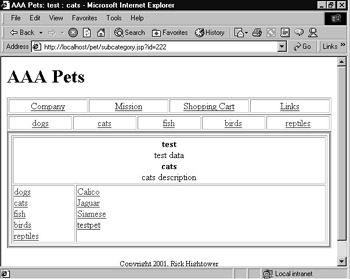
Add the "id" parameter and set it to a valid subcategory id. Note that 222 should be a valid subcategory identifier, but we need to check the DB just in case we deleted it. To add an "id" parameter, click on Add in the Web-controller configuration pane. Type "id" for the name and "222" for the value. In the next two figures, the first displays the pane and the second shows the corresponding browser view of the same URL.
-
Repeat the last step for the product page test. That is, set up the ability to access the product, as in http://localhost/pet/product.jsp?id=2221 . Add another Web-testing controller as follows:
-
Set the name to ProductWebTest.
-
Set the domain to localhost.
-
Leave the port at 80.
-
Set the path to pet/product.jsp (as in http://localhost/pet/product.jsp?id=2221 ).
-
Add an "id" parameter set to "2221".
-
-
Now that the Web controllers are set up, we'll set up a timer. For this example, we will use a constant timer. Go to the Navigation ThreadGroup node, right-click it, and choose Add, Timer, Constant Timer from the pop-up menu. When we are setting up a test, we like to slow down the timer so we can see if the test is really doing what we expect it to. To set the timer interval to 3 seconds, use a value of 3000 (the timer works with milliseconds ).
-
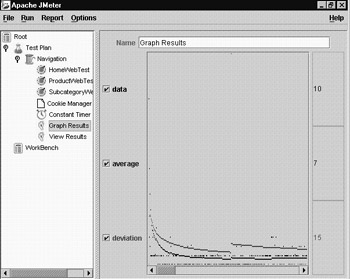
We need a way to view our results. Right-click the Navigation ThreadGroup, and choose Add, Listener, Graph Results from the pop-up menu. As we stated earlier, the first time a test runs, it is good to see the real HTML flying by; so, add a View Results listener, as well (select Add, Listener, View Results from the pop-up menu).
Now that we can see the results, let's run the test. Select the Navigation ThreadGroup and then select Run, Start from the main menu bar.
There are two ways to know the test is working: We can look at the View Results listener and see the pages of HTML, or we can look at the data being spit out to the console by JMeter, as follows:
Sampling url: http://localhost:80/pet Original location=http://localhost/pet/ Modified location=http://localhost/pet/ Sampling url: http://localhost:80/pet/ Sampling url: http://localhost:80/pet/subcategory.jsp?id=222
The console indicates test errors on the product.jsp because the current subcategory is in the Web application session information. We have not set up JMeter to track session information. The error when trying to load product.jsp is as follows:
Sampling url: http://localhost:80/pet/product.jsp?id=2221 java.io.FileNotFoundException: http://localhost:80/pet/product.jsp?id=2221 at sun.net.www.protocol.http.HttpURLConnection.getInputStream (Unknown Source) at java.net.HttpURLConnection.getResponseCode (Unknown Source) at org.apache.jmeter.protocol.http.sampler.HTTPSampler.getErrorLevel (HTTPSampler.java:191) at org.apache.jmeter.protocol.http.sampler.HTTPSampler.sample(HTTPSample
This happened quite by mistake. Remember, we said the pet store Web application was not robust. Well, we did not lie; as it happens, the pet store Web application needs session data to traverse to the products correctly. You don't want this feature in a real Web application, but this Web application is non-robust by design.
However, a real Web application may hold important session information like user id, preferences, affiliations, and so on. This information may provide a customized view or provide some filtering on a per- user / per-session basis. Therefore, this snafu lends an excellent opportunity to show you how JMeter can track session information.
The default behavior of many JSP and Servlet engines is to send a special cookie to the client to track session information. A cookie is a name/value pair that is stored on the client's machine. The cookie is associated with a particular URL, and it's sent when you access pages under that URL. Thus, we must set up JMeter to receive and transmit the cookie back to Web application server. Fortunately, this is easy to do with JMeter: All we have to do is add a cookie manager to the thread navigation ThreadGroup (Add, Config Element, Cookie Manager), and JMeter does the rest. When we rerun the test, it will work this time.
So far we've been lobbing softballs at our Web application. Now that we know it runs, it's time to play hard ball. Set the thread count to 100 on the Navigation ThreadGroup, and reduce the time to 300 milliseconds on the timer. Save any work in open programs before starting this test. Run the testlet ˜er rip!
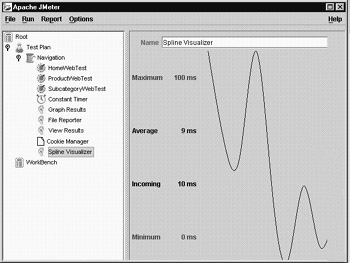
We find the graph useful, but we also like to dump the data out to a file and read it in with a spreadsheet application (Excel) and some Python stats package we wrote. In addition, we find the spline visualizer useful in seeing the runtime performance of the system. Add the spline visualizer to the Navigation ThreadGroup by right-clicking and choosing Add, Listener, Spline Visualizer from the pop-up menu.
Now, add the file reporter to the Navigation ThreadGroup (select Add, Listener, File Reporter). Click on the File Reporter element and set the output file location (for example, /tmp/output.log). Now, let's run it again.
After running the spline visualizer, we can see that the average access time is around 444 milliseconds, and we get a very interesting view of the runtime data:
In addition to the data shown in the previous figure and the graph from the first run, we can import the output data recorded by the File Reporter into our favorite spreadsheet or other analysis software and create a custom report. Here is a sample file listing of the date in verbose mode:
http://localhost:80/pet/product.jsp?id=2221 200 http://localhost:80/pet/subcategory.jsp?id=222 220 http://localhost:80/pet/subcategory.jsp?id=222 230 http://localhost:80/pet/ 220
In this example, we set up a ThreadGroup; added Web-test controllers to the ThreadGroup; set up a timer; added a cookie manager; and set up a graph, file reporter, and spline visualizer listener. In the next section, we'll create a script that can simulate form entry.
EAN: 2147483647
Pages: 228
- The Four Keys to Lean Six Sigma
- Beyond the Basics: The Five Laws of Lean Six Sigma
- Making Improvements That Last: An Illustrated Guide to DMAIC and the Lean Six Sigma Toolkit
- The Experience of Making Improvements: What Its Like to Work on Lean Six Sigma Projects
- Six Things Managers Must Do: How to Support Lean Six Sigma