Results
|
| < Day Day Up > |
|
The results of the tests are shown in Figures 6-6 and 6-7. The legends can be interpreted as follows:
-
L1U stands for local 1 virtual user load. The L implies that a local EJB was used and hence the serialization cost is not incurred.
-
1U and 2U stand for 1 and 2 virtual users using the remote version of the object.
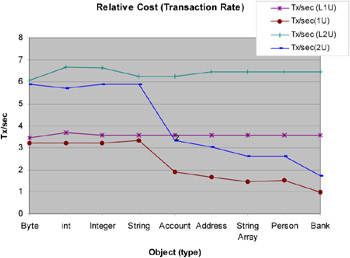
Figure 6-6: Transaction rates for different object types (1 user CPU ~27%, 2 user CPU ~53%)
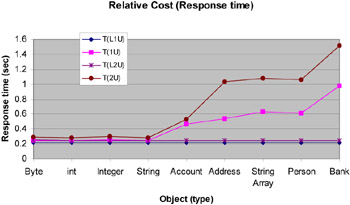
Figure 6-7: Response time cost for different object types
The cost of serialization can be interpreted as the difference in the transaction rates when the local and remote interfaces of the EJB are used. For instance, the transaction rate with one virtual user (Tx/sec L1U) drops from ~3.5/sec to ~1.5/sec (Tx/sec (1U)) for a string array object. In case of two virtual users it drops from ~6.5/sec to ~2.5/sec.
Figure 6-6 shows that the costs of serialization in terms of the transaction rate operations increase with the complexity of the object. Among the user-defined objects the Account object is the simplest and clearly a 1000 iterations of serialization take less time than a user defined Bank object. The serialized Bank object is almost nine times the size of a serialized Account object. The implication is that the network could play a role in the time measurements, but because the EJB and the servlet are on the same machine we can choose to ignore network costs. In other words we can attribute the differences in performance to the local and remote object semantics and hence serialization costs.
Figure 6-7 shows the cost of serialization as a function of the average response times for the base transaction of 1000 serialization and deserialization operations. It is clear that complex object types have an adverse effect on the response times. Most of the difference in response time with the local version and remote version of the EJBs can be attributed to the work done by the CPU on serialization. Once again the network costs and latency are neglected because the servlet client and EJB are on the same physical machine.
Figure 6-8 compares the transaction rate for the local and remote versions of two objects namely Person and Account. The lines being parallel would imply that the cost of serialization and deserialization remains constant with increased load. However, this is not the case.
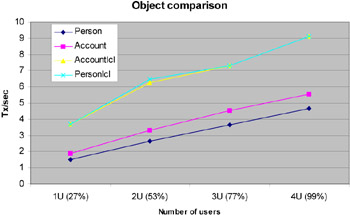
Figure 6-8: Comparison of transaction rate for different objects and number of users
Figure 6-9 shows the transaction rate comparisons for objects that have an inheritance hierarchy (Account Holder) and those that handle their own serialization rather than rely on the default virtual machine serialization (PersonOpt). In this case, the inheritance hierarchy has not translated to performance degradation.
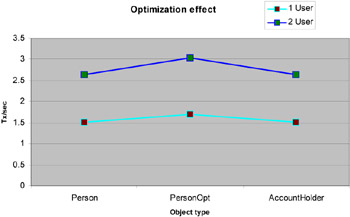
Figure 6-9: Transaction rate of optimized and inherited objects
|
| < Day Day Up > |
|
EAN: N/A
Pages: 117