Workload management observations
|
| < Day Day Up > |
|
Examples of workload management
During our test period, IBM's development team provided updated versions of the WebSphere plug-in, having enhanced the plug-in's function and fixed problems reported by customers. In general, we applied these updated versions of the plug-in to our system as soon as they were available.
In addition to the detailed logging of workload management decisions described above, our principal technique for high level monitoring in this area was to look at the CPU use across our four application servers.
Examples of round robin load balancing
Figure 4-7 is an example from an early stage in our testing. It illustrates some of the workload management effects that required focus. This example used the default round robin load balancing algorithm.
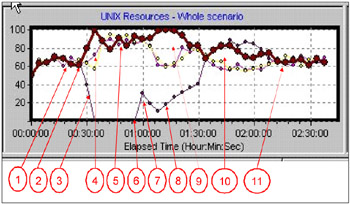
Figure 4-7: CPU use on four application servers during failure and recovery
It should be pointed out that more recent levels of the WebSphere plug-in exhibit significantly better balance in their workload management (see Figure 4-7).
The explanation for the annotation:
-
After ramping up the workload, the four servers are evenly balanced at around 65% utilization on each server.
-
At this point, all the application server clones (and the WebSphere Application Server function itself) on one of the four server nodes were abruptly shut down using the AIX 'kill-9' command.
-
CPU use on the unavailable server drops to zero.
-
Workload is redistributed to the surviving three servers, but initially, is not evenly distributed. During this period the various instances of the WebSphere plug-in gradually discover the unavailability of the missing application server clones. On discovering a clone's unavailability, an instance of the plug-in starts its RetryInterval timer and will not retry accessing that particular clone until the RetryInterval has expired.
-
After a period, workload is evenly balanced across the three surviving servers. The workload level (around 85%-90% utilization on each) is consistent with redistributing the workload from four 65% loaded servers to the three remaining servers (4 x .65 = 2.6 which is 87% of the capacity of three servers).
-
At this point, WebSphere and all three clones on the unavailable server are restarted.
-
The initial peak of CPU use is caused when WebSphere and the application server clones initialize themselves.
-
The workload gradually increases on the revived server. This is caused by two effects:
-
Instances of the plug-in that had discovered the unavailability of one or more of the clones gradually begin to have their RetryInterval timers expire, and restore the clones to their list of available target application servers.
-
Some instances of the plug-in may have not attempted to access the missing clones during the time they were unavailable, and now happen to select one of the clones for a particular user session. In this case, since the clone is available, the work is handled, and the particular instance of the plug-in in question never became aware that the clone had been unavailable
-
-
During the period of recovery, workload distribution is not evenly balanced. This problem was fixed in a later version of the plug-in.
-
After the workload level on the recovered node reaches the common level of 65% use, load balancing remains uneven for a period.
-
Load balance settles down to roughly equal workload on all four servers.
Recent example of round robin load balancing
After installing an updated level of the plug-in, including a fix to the problems shown in steps 9 and 10 above, load balancing was much improved across the four application server nodes. In this case, the test actions carried out were the same as those in the example shown in Figure 4-8.
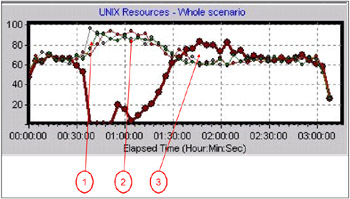
Figure 4-8: Round Robin load balancing after installing the updated version of the WebSphere plug-in
The explanation of the annotation:
-
Some imbalance remains immediately following the triggering of failover.
-
The former imbalance during clone recovery is now fixed.
-
Some imbalance remains after parity has been reached
Comparing Figures 4-7 and 4-8 shows that load is fairly evenly balanced across the four application server nodes during the recovery section of the test. Some imbalance is still apparent immediately after the targeted clones are rendered unavailable.
Workload management examples using random load balancing
Figure 4-9 shows the same level of plug-in as was used in the tests shown in Figure 4-8.
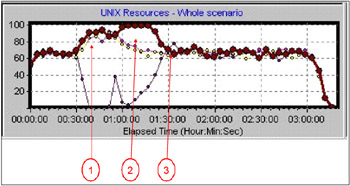
Figure 4-9: Early load balancing example with random load balancing
The explanation of the annotation:
-
Load balancing behaves correctly immediately after failover is triggered.
-
Imbalance remains during clone recovery
-
From the point that the recovered clones reach parity with the other clones in terms of workload, the load is evenly balanced.
This one shows that with that level of plug-in, random load balancing gave 'better' results. 'Better' in this case means there is less variability of load distribution and quicker establishment of parity in workload.
Figure 4-10 shows the results of a test using random load balancing and the same recent level of plug-in used in the test shown in Figure 4-8.
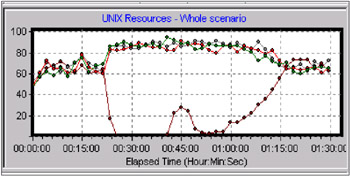
Figure 4-10: Random load balancing with updated version of the WebSphere plug-in
In Figure 4-10, it can be seen that workload is well balanced throughout the test.
Minimizing the user impact caused by an unresponsive clone
In Failover Test 4 we abruptly severed the network connection between one of the application servers and the database server.
The characteristics of this test were that the clones were unable to complete client requests because of not being able to access the database server, and so stopped delivering responses to clients. However, the WebSphere Web container continued to accept new requests until the thread pool was full and the connection backlog was exhausted. Only then would a plug-in find that a connection request was rejected, and therefore mark the clone as down.
The failover characteristics and the remedies for minimizing the impact on end users that apply to this test are likely also to apply to any other form of failure where the application server clone remains accessible from the HTTP server but does not deliver responses to client. Examples of this could be rogue or badly written portlets that consume server resources and eventually fail to deliver responses to clients. We characterize this behavior as an 'unresponsive clone'.
Figure 4-11 shows the workload management pattern we observed when we first ran this test.
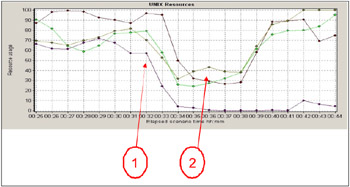
Figure 4-11: Workload distribution when application server access to the database server was disabled
The explanation of the annotation:
-
At this point, the 'problem' node was disconnected from the database by disabling the network interface on the database side of the server.
-
Throughput on the surviving nodes is depressed for five to ten minutes.
The significant feature of this graph is that shortly after database server access was disabled on one of the nodes, instead of rising to accommodate the displaced workload from the disabled server, the workload on the surviving servers was depressed initially by about 40% for an extended period, in this case lasting more than five minutes.
The explanation for this apparently surprising phenomenon:
-
As in all our tests, we used Mercury Interactive's LoadRunner to drive 1,000 virtual users. Each virtual user executes one iteration of the test script then waits for ten seconds before starting a new iteration as a new user. If the script receives anything other than a normal response to an HTTP request for a page, it terminates the iteration and starts a new iteration.
-
When database access is disabled, in-flight transactions cannot complete, and the lack of response from the application server eventually results in a browser timeout. In the case of our testing, the LoadRunner virtual users would time out after around five minutes. In the real world, browsers typically time out after about two minutes, but it is more likely that a human user would lose patience in less than two minutes, press 'stop' on the browser, and then retry the request.
-
Each of the three application server clones on the 'problem' node independently manages its Web container pool and connection backlog. With the values set at the time the above test was run, the Web container pool was set at 70 and the connection backlog at 128. As a result, each clone is capable of absorbing 198 (128 + 70) requests before new connection requests from plug-ins begin to be rejected.
-
With three clones on the 'problem' node, this means that almost 600 of our 1,000 virtual users could end up 'hung', each with a request accepted on the problem node but not receiving any response. Each virtual user remains in this state until its own page download timeout expires.
-
This accounts for the depression in the workload handled by the surviving nodes - up to sixty percent of the virtual users are hung waiting for responses from clones on the problem node - only forty percent of them are having their requests routed to the surviving nodes.
-
When the connection backlogs are full and the page download time-outs begin to expire, the plug-ins have new connection requests rejected by the problem node and mark the clones as down.
-
Only when this last stage is reached does the workload on the surviving nodes begin to build up to the correct level.
One of the objectives we pursued in this test was to find a set of WebSphere and Portal parameters that would minimize the impact on end users, in particular to reduce the degree to which throughput is depressed on the surviving nodes, and to minimize the duration of the period of depression.
Figure 4-12 shows the effect we observed in changing a number of key parameters
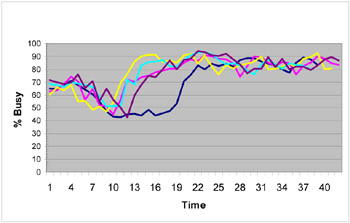
Figure 4-12: The effects of changing WebSphere timeout parameters on the depth and duration of workload depression on surviving servers in the presence of unresponsive clones
The resulting parameters are specified in the section Best practices advice.
Each line is the average CPU use over the three surviving servers in a particular test run. The different lines show the effect of different combinations of parameters. The lines show combinations of parameters as follows
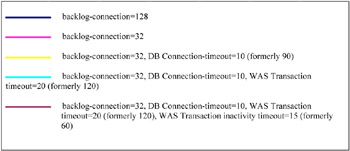
Figure 4-13: Color definitions for Figure 4-12
It is worth noting that at the rate of establishing new sessions in this test, the default connection backlog value of 511 leads to taking about 16 minutes for the backlogs to fill up. Changing the backlog value to 128 reduces this time delay to around four minutes, a significant improvement from the point of view of users of the portal.
|
| < Day Day Up > |
|
EAN: N/A
Pages: 117