WebSphere Studio Application Developer
|
WebSphere Studio Application Developer is designed for the creation of more complex projects, providing fully dynamic web applications utilizing EJBs. In addition to the complete function of Studio Site Developer, the Application Developer edition adds complete EJB tool support. This consists of the basic EJB tools, CMP and data-mapping tools, and a Universal Test Client that is designed to aid testing of EJBs. Finally, there is a complete set of profiling, tracing, and performance analysis tools included in Application Developer to ensure your resulting application performs and functions correctly.
J2EE Projects
If you have moved beyond simple servlets and wish to create a complete J2EE application using EJBs, the J2EE perspective is likely where you will spend the majority of your time. The primary feature of this perspective is a new view that replaces the Navigator view, and provides an overview of all relevant files in the workspace. The view categorizes the files by content type, listing all the web projects, EJB projects, enterprise application projects, and so on. This is a dynamic view, so any changes made here will be immediately reflected in the underlying resources view, and vice versa:
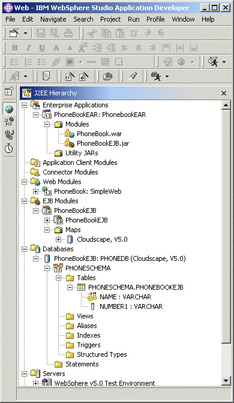
All the J2EE module creation wizards allow you to select an enterprise application project to contain the new module, so the creation and assembly of your complete application should take place almost automatically. However, if you wish to modify the resulting EAR in any way, the J2EE view is the best place to do so. The physical layout of enterprise applications, EJB projects, and web projects in the workbench file system is that all projects are created as peers. You may expect EJB and web projects to be physically children of a containing enterprise application project, but that structure would prevent the use of the same modules in more than one enterprise project.
This approach allows the modules to be created and reused with ease, and the logical containment of EJB web projects in an enterprise projects is represented via the J2EE view. As described with web projects above, the assembly of all projects into their correct file types and containing modules is now strictly a packaging step that can be completed on export if desired. The unit test server can be run, and all development can be completed without having to create the actual archive files.
The structure of an enterprise application project does represent the contents of the resulting archive. There is a /META-INF directory that contains the various metadata files – both the spec-defined ![]() application.xml and the IBM extensions. In general it should not be necessary to directly manipulate the content of the files, as the provided enterprise application editor will give a logical view of the data while ensuring the correct files are updated.
application.xml and the IBM extensions. In general it should not be necessary to directly manipulate the content of the files, as the provided enterprise application editor will give a logical view of the data while ensuring the correct files are updated.
The J2EE view also provides an optimized view of your EJB projects; there are many additional files required while executing an EJB. However, the basic premise of the EJB specification is to shield you from the underlying complexity. Therefore, the only source files visible for an EJB in this view are the important, specification-defined, user-created ones: the bean itself, the home, remote, and local interfaces, and the key class. Double-clicking on the EJB node in the tree view will open the EJB editor, allowing changes to be made to the deployment descriptor.
In addition to the modules required to assemble your application, the databases used and server definitions are also available in the J2EE view. This provides an easy way to access the various files, as opening the files from this view will reuse the same editor available in other views.
Utility JARs
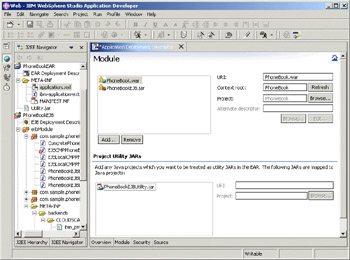
Any reasonably sized application will generally include utility code that falls outside the scope of the specification-defined modules, or needs to be reused by several modules. The enterprise application editor now provides the ability to define a Java project as a utility JAR. Once so designated, the Java project will be available as a dependent archive in all projects that are contained in the same enterprise application. If selected as a dependency, the Java builder classpath will be set correctly, allowing the code assist to work correctly, and the actual compilation to succeed.
In addition, the MANIFEST.MF file in the archive will indicate the dependency, ensuring that the code will all work correctly at runtime. As above, the physical assembly of the Java project into a JAR is just a packaging step, and is not required to develop or test the application in the Studio test environment. When you wish to test your application on a remote server, the publishing action will create the required JARs for you. If you wish to deploy the application to a production server, you can export the JARs or EARs using the export wizard:
Enterprise JavaBean Tools
EJBs are discussed in depth throughout later chapters, so we will limit this discussion to an introduction to the EJB capability in Studio. WebSphere Studio Application Developer version 5.0 supports the creation and deployment of both 1.1 and 2.0 EJBs. The project type itself must be defined at creation time, as the DTD of the deployment descriptor has changed between versions. An EJB 2.0 project can contain CMP beans with both 1.1 and 2.0 style persistence, although it is not recommended that you mix the two in a single JAR.
The EJB project creation wizard is very similar to the web project creation wizard, prompting first for the desired specification level, and then for any module dependencies. The structure of an EJB Project is also consistent with web projects; there is a single directory (ejbModule) that represents the contents of the resultant archive. Any files that are placed in this directory will also be included in the output JAR; any files that are associated with the project, but that you do not wish to distribute should be located in any directory you have created in the root of the project, as a peer to ejbModule.
Within ejbModule is a /META-INF directory, which contains the deployment descriptor and associated metadata files. The WebSphere extensions take the form of several additional files in this directory:
| File Name | Description |
|---|---|
| META-INF/ejb-jar.xml | Spec deployment descriptor |
| META-INF/ibm-ejb-jar-ext.xmi | IBM deployment descriptor extensions |
| META-INF/ibm-ejb-jar-bnd.xmi | IBM deployment descriptor bindings |
| META-INF/map.mapxmi | Mapping information for CMP beans |
| META-INF/schema/* | Schema information for CMP beans |
Note that you can also define multiple schema maps for beans with version 2.0 persistence, but this scenario will result in additional metadata files saved in the META-INF tree.
Despite the fact that the EJB metadata spans multiple files, there is a single EJB editor used to edit the deployment descriptor and associated extensions. The multi-page editor is opened from the deployment descriptor file in the Navigator view, or from the EJB icon in the J2EE view. The specification-defined aspects of the deployment descriptor, and the IBM extensions and bindings aspects are both available in the same editor, avoiding the need to flip between editors when configuring a single bean – although the extensions are clearly marked as such in the editor, and can even be disabled via a preference if desired:
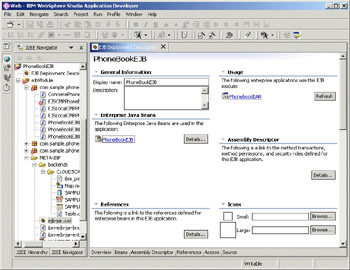
The last page of the editor is a source page, allowing you to view the resulting deployment descriptor. This is a live view, so changes can be made in the source page and they will be immediately reflected in the other pages of the editor.
As described above, the J2EE view shows the critical files for an EJB as nodes in the main Navigator view tree. When editing the bean in the Java editor in this perspective, the Outline view of the file can also be used to add methods to or remove methods from the home or remote interface.
Entity EJBs with CMP require a schema, and a mapping of CMP fields to that schema, to generate the code to implement that persistence. Studio can generate a schema from an EJB definition (known as "top-down"), or you can use the mapping editor to connect an existing schema definition to the entity ("meet in the middle"). These modes of operation can be mixed, allowing you to create a top-down map, and then modify it in the mapping editor. You can also create a new EJB from an existing schema definition, as a so-called "bottom-up" operation.
The metadata files are saved in the JAR, allowing the batch mode EJBDeploy tool to run outside the workbench, and still reflect a comprehensive schema map. When running the top-down schema creation, the database vendor must be defined. The resulting code to implement a particular mapping is type specific, not vendor specific – but the optimum selection of types may vary by vendor.
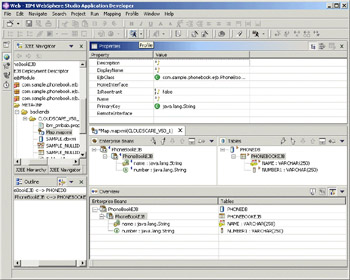
We want to use a CMP EJB to persist the data for our phonebook application. The resulting EJB is very simple, containing just two fields – a name and a number. The following screenshot shows how this EJB is mapped to the schema we defined previously. The mapping editor provides several views of the components to aid in the correct mapping, but can usually provide most mappings automatically. The upper half of the editor shows the input data, CMP beans and their fields on the left, and the schema, tables and columns on the right. The lower half of the editor, labeled Overview, shows the mappings that have been completed:
Having completed the mapping operation, the next step is to deploy and execute the bean. The deployment action can be run from the J2EE view, and simply generates the correct code to execute the bean in the container with the desired persistence. To run the EJB, the Run on Server action described above can be selected from the bean's node. This will configure and start the server, and open the Universal Test Client.
Universal Test Client
Testing of web applications is relatively simple, as they are designed with a user (web) interface. You must run the server, and interact with them via a browser, but the method of that interaction is clearly defined. Testing of EJBs is not quite as simple, as they only provide a Java interface. It is certainly possible to create a Java client to test the interaction with the bean, but that client then needs to be configured to interact with the server, and the resulting operation is fairly cumbersome to manage just for a test harness.
To address these issues, Studio includes a web application called the Universal Test Client. This application is optionally included in the server configuration, allowing you to interact with it anytime the server is operational. The testing can also be done from any web browser that has access to the server – the embedded browser within Studio is ideal for this, but you can also an external browser if you prefer.
The test client starts by listing the JNDI namespace. You can either enter the name of the bean you desire, or navigate through the tree to find it:
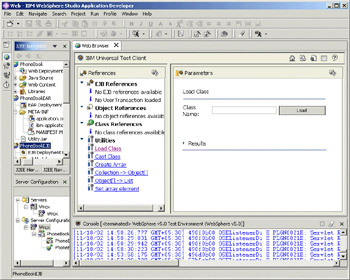
Once you have located the home bean, you will see the methods on the home bean displayed. Invoking a create() or find() method will return a bean instance, which can then be expanded. Any object that is returned can be added to the tree on the left, not just EJBs; objects are dynamically introspected, and so the results can be displayed, and further methods invoked, as required. The same test client can also be used to interact with returned JavaBeans, when working with web services.
Analysis Tools
A complete collection of application analysis tools is available in Studio, including tracing the flow of distributed applications, performance analysis of those applications, and server log analysis and problem determination.
Profiling and Performance Analysis
The distributed trace support requires the installation of the Remote Agent Controller on the remote machines, but this is also required for the remote server support and so may already be installed. To trace an application, you first start the server in profiling mode from within Studio. In the profiling perspective you then attach to the application you have started (which may be on the local or a remote machine), start the monitor, and then just use your application as you would normally. All usage is now being captured, and flows back to Studio, even as the application makes calls to other applications, or across machine boundaries.
When the application is complete, you can close it down, and display the results of the analysis in a large number of different textual and graphical formats. One of the most useful views is the Sequence Diagram, as shown below. This diagram provides a call flow of the application on a UML-style interaction diagram, including the relative performance of the call as a coloured bar on the left of the screen. The brighter the colour, the longer that method took:
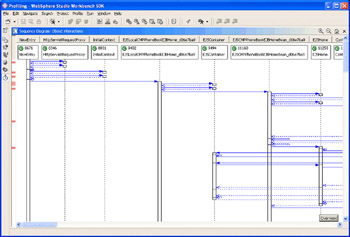
Guided by this overview of the performance, you can then open the details page of the data, which will show the exact time spent in each method, and in turn allow you to focus on the performance bottlenecks of your application.
Logging
The log analyser tool provides a mechanism to import a WebSphere-generated log file, view it graphically, and then compare it with a symptom database. If you are having trouble activating or configuring a WebSphere server, either locally or remotely, the log analyser can help you navigate the different logs that are generated to identify the likely cause. Problems that can be identified by the log analyser range from common configuration errors, to defects in the code for which fixes are available. Suggestions for fixing recognized problems are then displayed in the window.
Updates to the symptom database can be downloaded (in Studio) from an IBM FTP site. This mechanism means that IBM can provide an updated symptom database reflecting the causes of recently discovered problems, and the log analyser tool will always be able to reflect the most recent and commonly encountered problems.
|
EAN: N/A
Pages: 135
- Structures, Processes and Relational Mechanisms for IT Governance
- An Emerging Strategy for E-Business IT Governance
- Measuring and Managing E-Business Initiatives Through the Balanced Scorecard
- A View on Knowledge Management: Utilizing a Balanced Scorecard Methodology for Analyzing Knowledge Metrics
- Governing Information Technology Through COBIT