Hack14.Build Dynamic HTML Graphs
Hack 14. Build Dynamic HTML Graphs
Using DHTML, you can build graphs that change without requiring even a page refresh. The result? Your users can play with data in real time. Something is fundamentally unsatisfying about the way the Web works. You click on a link, the page disappears, and that lovely spinning ball or ticking clock grinds by as a new page appears section by section, (hopefully) with the information you want. This certainly is not the interactivity we're all used to from our client-side applications. But, thank goodness, you can make an application that works without a page refresh. This hack shows you how to make an interactive scatter plot using a few graphics, some PHP, and a whole slew of JavaScript. 3.5.1. The CodeThe index file, index.php, is shown in Example 3-5. Example 3-5. JavaScript, the real workhorse in this hack <?php $states = array( array( "Alabama",4447100,1963711,52419.02,1675.01,50744,87.6,38.7 ), array( "Alaska",626932,260978,663267.26,91316,571951.26,1.1,0.5 ), array( "Arizona",5130632,2189189,113998.3,363.73,113634.57,45.2,19.3 ), array( "Arkansas",2673400,1173043,53178.62,1110.45,52068.17,51.3,22.5 ), array( "California",33871648,12214549,163695.57,7736.23,155959.34,217.2,78.3 ), array( "Colorado",4301261,1808037,104093.57,376.04,103717.53,41.5,17.4 ), … array( "Washington",5894121,2451075,71299.64,4755.58,66544.06,88.6,36.8 ), array( "West Virginia",1808344,844623,24229.76,152.03,24077.73,75.1,35.1 ), array( "Wisconsin",5363675,2321144,65497.82,11187.72,54310.1,98.8,42.7 ), array( "Wyoming",493782,223854,97813.56,713.16,97100.4,5.1,2.3 ), array( "Puerto Rico",3808610,1418476,5324.5,1899.94,3424.56,1112.1,414.2 ) ); ?> <html> <head> <script language="Javascript"> var width = 300; var height = 300; var axes = [ "population", "housing_units", "total_area", "total_water", "total_ land", "people_density", "housing_density" ]; var data = [ <?php $first = true; foreach( $states as $state ) { if ( !$first ) echo( "," ); ?> { state: "<?php echo($state[0]); ?>", population: <?php echo($state[1]); ?>, housing_units: <?php echo($state[2]); ?>, total_area: <?php echo($state[3]); ?>, total_water: <?php echo($state[4]); ?>, total_land: <?php echo($state[5]); ?>, people_density: <?php echo($state[6]); ?>, housing_density: <?php echo($state[7]); ?> } <?php $first = false; } ?> ]; var axmin = {}; var axmax = {}; for( axind in axes ) { axmin[ axes[axind] ] = 100000000; axmax[ axes[axind] ] = -100000000; } for( ind in data ) { row = data[ind]; for( axind in axes ) { axis = axes[axind]; if ( row[axis] < axmin[axis] ) axmin[axis] = row[axis]; if ( row[axis] > axmax[axis] ) axmax[axis] = row[axis]; } } function cleargraph( ) { graph = document.getElementById( "graph" ); graph.innerHTML = ""; } function adddot( value, size, x, y, text ) { var left = x - ( size / 2 ); var top = width - ( y + ( size / 2 ) ); var cleft = "auto"; var ctop = "auto"; var cright = "auto"; var cbottom = "auto"; if ( left < 0 ) { cright = ( left * -1 ) + "px"; } if ( left + size > width ) { cleft = ( width - left ) + "px"; } if ( top < 0 ) { ctop = ( top * -1 ) + "px"; } if ( top + size > height ) { cbottom = ( height - top ) + "px"; } if ( value <= 0.25 ) img = "ltgray.gif"; else if ( value <= 0.50 ) img = "gray.gif"; else if ( value <= 0.75 ) img = "dkgray.gif"; else img = "black.gif"; html = "<img src=\""+img+"\" width=\""+size+"\" height=\""+size+"\" "; html += "style=\"position:absolute;left:"+left+"px;top:"+top+"px;"; html += "clip:rect( "+ctop+" "+cleft+" "+cbottom+" "+cright+" );"; html += "\" onclick=\"alert(\'"+text+"\')\"/>"; graph = document.getElementById( "graph" ); graph.innerHTML += html; } function calculate_value( row, field, min, max ) { var val = row[ field ] - axmin[ field ]; var scale = ( max - min ) / ( axmax[ field ] - axmin[ field ] ); return min + ( scale * val ); } function drawgraph( ) { cleargraph( ); var xvar = document.getElementById( "bottom" ).value; var yvar = document.getElementById( "side" ).value; var sizevar = document.getElementById( "size" ).value; var valuevar = document.getElementById( "color" ).value; for( rowind in data ) { var row = data[rowind]; var x = calculate_value( row, xvar, 5, width - 5 ); var y = calculate_value( row, yvar, 5, height - 5 ); var size = calculate_value( row, sizevar, 5, 30 ); var value = calculate_value( row, valuevar, 0, 1 ); adddot( value, size, x, y, row.state ); } } function buildselect( axis, current ) { var html = "<select id=\""+axis+"\" onchange=\"drawgraph( )\">"; for( axind in axes ) { var selected = ""; if ( axes[axind] == current ) selected = " selected=\"true\""; html += "<option value=\""+axes[axind]+"\""+selected+">"+axes[axind]+" </option>"; } html += "</select>"; document.write( html ); } </script> </head> <body onload="drawgraph( );"> Side: <script language="Javascript">buildselect( "side", "population" );</script> Bottom: <script language="Javascript">buildselect( "bottom", "housing_units" );</ script> Size: <script language="Javascript">buildselect( "size", "total_area" );</script> Color: <script language="Javascript">buildselect( "color", "total_water" );</ script> <div style="position:relative;border:1px solid #eee; clip:rect(0px 0px 300px 300px); width:300px; height:300px;" > </div> </body> </html> The script starts by creating the data array, first in PHP and then in JavaScript. The data needs to be available to JavaScript so that the graph can be dynamically built on the fly using DHTML. Once the data is loaded into the page, the rest is left up to the browser. The first thing the browser does is create the drop downs using the buildselect( ) function. Then, the onload() event fires on the body tag, which calls the drawgraph() function. This function in turn creates a new HTML string that's made up of lots of img tags, one for each state. The size of the image, as well as the position of the image on the graph, depends on which data attributes are assigned to what graph attributes via the drop down. Once the graph is created, the drawgraph() function sets the inner HTML of the graph <div> tag to the new HTML, rendering all of the images. If the user selects a different attribute with one of the drop downs, the drawgraph( ) function is called again, and the graph is updated. 3.5.2. Running the HackUpload the PHP page and the images to the server, and then navigate to the page in your web browser. You should see something along the lines of Figure 3-6. Now use the combo boxes to assign different variables to the different portions of the graph. The Side drop down changes the Y axis. The Bottom drop down changes the X axis. The Size drop down sets which of the attributes will alter the size of the ball, and the Color drop down assigns a data attribute to the color of the ball. The Y axis represents housing units, and land area increases along the X axis. While most of the plot appears closely packed, there are a few outliers. Click on one of these to see which data point is represented; for instance, clicking on the black ball in the lower righthand corner results in the pop up shown in Figure 3-7. This tells me that, not surprisingly, Alaska has the largest total size but has very few housing units. The size of the ball tells me that Alaska has a large amount of land mass as well. I'm not surprised by the size of the land mass, but the very low housing units number is somewhat interesting. There are also two other outliers: the medium gray ball in the middle of the graph (Texas), and the ball at the very top of the graph (California).
Figure 3-6. The scatter plot after some experimentation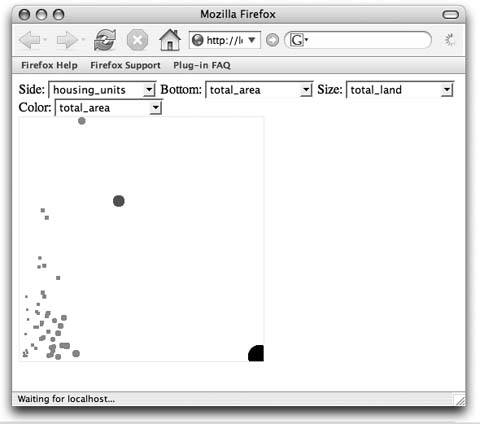 Figure 3-7. After clicking on the ball in the lower-right corner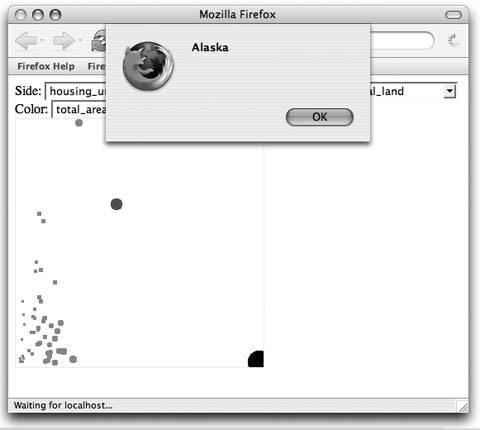 3.5.3. See Also
|

EAN: 2147483647
Pages: 163