Debugging Java Applications Using Eclipse
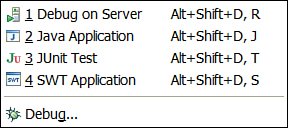
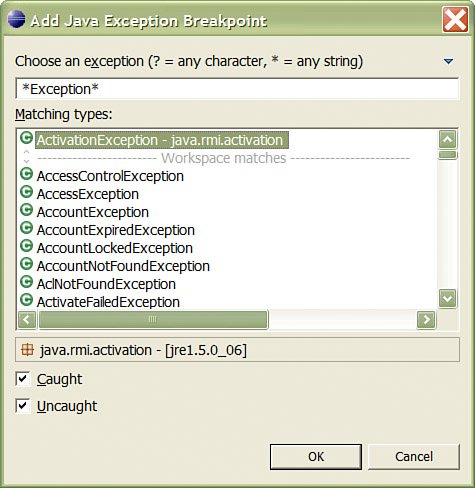
| GUI-based debuggers are excellent tools for detecting and fixing bugs because, among other things, they allow us to step through code and inspect variables. However, another feature often overlooked is that debuggers can also help you think about how your code is organized when you are stepping through the code; this can help you improve the stability of the code by allowing you to imagine the various ways your code could potentially break. The Eclipse Java Development Tools (JDT) comes bundled with a debugger that provides stable and robust GUI-based Java debugging (it is quite impressive, really). Java IDEs have indeed come a long way, in that they have robust features, a stable debugging environment, local as well as remote debugging capabilities, all the features of typical GUI debuggers, and some new and exciting ones such as Eclipse's Hotswap, which allows us to fix code on-the-fly (explained later). I wrote my first-ever article about Symantec's Café (precursor to Visual Café) back in August of 1996 (for Dr. Dobb's Journal). Since then, I worked with Visual Café and Borland's JBuilder for a short while but found these IDEs to be clunky and their debuggers to be somewhat unstable. (What puzzles me the most is that I was using debuggers that enabled step-through-code style debugging almost 15 to 20 years ago with languages such as C/C++; so why it has taken so long for Java debuggers to get to this point is beyond my comprehension.) The Eclipse JDT debugger is quite promising as far as its feature set and its consistency and stability are concerned. So let's take a look at some of its features here. If you have not read Chapter 8, I encourage you to do so prior to reading this section, because I'll assume that you have some understanding of the Eclipse platform and the JDT. For starters, let's look at how we begin the debugging process in Eclipse. Eclipse enables us to debug various types of Java programs. Figure 9.1 shows some of the options available to us. Now let's look at the various concepts and features of the JDT debugger. Figure 9.1. Eclipse's debug context menu. JDT Debugging Concepts and FeaturesThe JDT debugger enables us to detect, diagnose, and fix our bugs nicely. We can debug programs running locally or remotely (if remote debugging is supported by the remote JVM). The debug client runs inside Eclipse, whereas the remote debugger server (assuming you are doing remote debugging) runs inside the same JVM your server program is running in. I will demonstrate local debugging here but give you pointers for remote debugging as well, which is similar to local debugging, after you have the remote server configured (a relatively simple step). Let's review some basic JDT debugger concepts next. The following is a list of debugging features provided by the JDT. Most of these features are available from the context menu (for the source code you are editing), Eclipse's Run menu, within one of the Debug views, or even by using shortcut keys. Hence, I will cover only the features and not point out where you can access them within Eclipse, because there are multiple ways of accessing them. Debug Perspective and ViewsFor starters, Eclipse provides a Debug perspective that conveniently organizes a set of views for us. Also, when we begin debugging a program, Eclipse automatically switches to this perspective. Some of the related views include debug, expressions, variables, breakpoints, console, and a few others. BreakpointsBreakpoints are location(s) in your program where we want execution of the program to suspend, giving us time to inspect the variables or change your code. Breakpoints can be set at specific lines of code (I tend to use Ctrl+Shift+B on Windows XP to toggle a breakpoint; you can also do this by double-clicking or right-clicking on the left side of the editor window). This is all we need to do to set a breakpoint. However, there might be times when we want a breakpoint to be effective only under certain conditions, so let's look at that next. After a breakpoint is set, we can set a hit count so that the program suspends at that breakpoint only after some number of hitsthat is, the number of times that code has been executed. (This is done from the breakpoint's context menu.) We can also set conditional breakpoints (using the breakpoint's properties). For example, we might want the program to stop at the breakpoint only if a variable equals a certain value (as demonstrated in Figure 9.2). One thing I should point out is that I personally almost never use the hit count and conditional breakpoint features. Figure 9.2. Setting conditional breakpoints.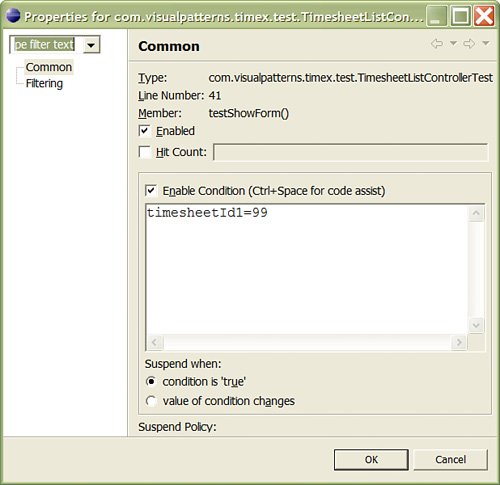 One last type of breakpoint you can set is by catching exceptions, as shown in Figure 9.3. This is done using the little "J!" toolbar button in the Breakpoints view. Figure 9.3. Java exception-based breakpoints. Stepping Through CodeAfter we have our breakpoints set and our program launched (using the Run, Debug option, for example), we can begin debugging our code by stepping through it. When a breakpoint is hitthat is, the program suspends at a certain line of codewe can either step into a method call, step over it, or return out of the current method and back into the calling method (that is, one level up in the call stack). We can even use step filters (from Windows, Preferences, Java, Debug) to selectively step into methods. Instead of stepping through every single line of code, we can set multiple breakpoints and resume execution of our program and have it automatically continue until the next breakpoint (effectively skipping all the steps between the two breakpoints). VariablesInspecting variables is one of the most important aspects of GUI-based debugging. After your program hits a breakpoint and suspends, you can look at the values of all the variables that are in scope (for example, local variables in a given method or class you are debugging). You can also watch expressions; for example, something like "periodEndingDate != null" can be added as an expression using the Watch view; this would appear as true in the Watch view if periodEndingDate does not equal to null. The one very powerful feature of working with variables is that we can also change their values. By changing the value of a given variable at a specific line of code, we can alter the entire flow of the debugging session on-the-fly. This feature complements the Hotswap feature (discussed shortly), which provides the capability to change code on-the-fly and continue debugging. One last feature worth pointing out is that you can display the value of a specific variable by selecting it in the source code and choosing Display from the context (right-click) menu. HotswapFixing Code On-the-Fly!This is such a cool and powerful feature that it almost makes me drool (well, not quiteI do have a life outside of work). Suppose we have stopped at a line of code triggered by a breakpoint and immediately realize the cause of the bug and want to fix it. Well, that's exactly what we should do! Immediately after we save the file (by pressing Ctrl+S, for example), Eclipse will recompile your class and reload the method in the same debugging session without the need for restarting the entire debugging session! How cool is that? What excites me about this feature is that it is almost instantaneous and the debugger automatically positions your current line to the beginning of the method you are in, essentially restarting the debugging session but just from the beginning of the method, not the entire call stack. Note that the Hotswap feature requires JRE 1.4 or later. Remote DebuggingEclipse enables us to debug remote programs as long as the remote server supports this feature. For example, I started Tomcat outside of Eclipse, on Windows XP, using the catalina.bat file using the following commands on the command line (notice the two environment variables that need to be set in advance): set JPDA_ADDRESS=8000 set JPDA_TRANSPORT=dt_socket catalina jpda start Incidentally, JPDA stands for the Java Platform Debugger Architecture (architecture for remote debugging; java.sun.com). After starting Tomcat, I was able to connect to it using the Run, Debug, Remote Java Application (right-click New) option. OtherYou should browse through the various options available in the debug-related views. You will find several toolbar options in these views that might pleasantly surprise you. One feature is the copy stack option available in the Debug view via its context menu; this can help in various ways (emailing the stack to a colleague, for example). This feature essentially copies the call stack to the Clipboard as plain text, as shown in the sample excerpt. TimesheetListControllerTest.testShowForm() line: 45 NativeMethodAccessorImpl.invoke0(Method, Object, Object[]) line: not available [native method] NativeMethodAccessorImpl.invoke(Object, Object[]) line: not available DelegatingMethodAccessorImpl.invoke(Object, Object[]) line: not available Method.invoke(Object, Object...) line: not available TimesheetListControllerTest(TestCase).runTest() line: 154 TimesheetListControllerTest(TestCase).runBare() line: 127 TestResult$1.protect() line: 106 TestResult.runProtected(Test, Protectable) line: 124 TestResult.run(TestCase) line: 109 TimesheetListControllerTest(TestCase).run(TestResult) line: 118 TestSuite.runTest(Test, TestResult) line: 208 TestSuite.run(TestResult) line: 203 RemoteTestRunner.runTests(String[], String) line: 478 RemoteTestRunner.run() line: 344 RemoteTestRunner.main(String[]) line: 196 |
EAN: 2147483647
Pages: 219
- Static PE-CE Routing Overview, Configuration, and Verification
- Deployment Scenarios with CSC Architecture
- TE Basics
- Case Study 2: Implementing Multi-VRF CE, VRF Selection Using Source IP Address, VRF Selection Using Policy-Based Routing, NAT and HSRP Support in MPLS VPN, and Multicast VPN Support over Multi-VRF CE
- Command Reference